
- Home >
- Stock Photos >
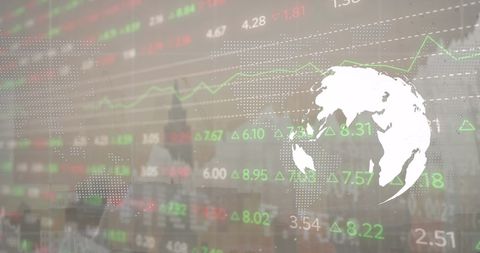
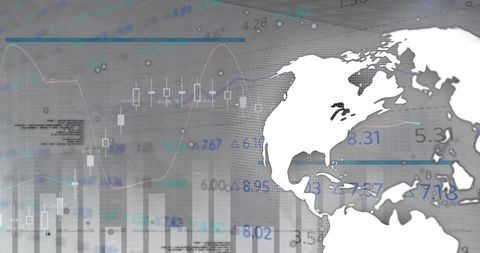
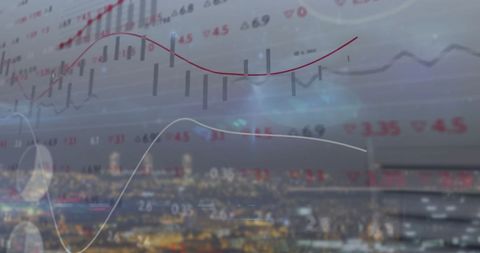
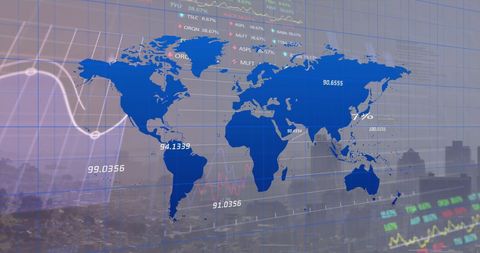
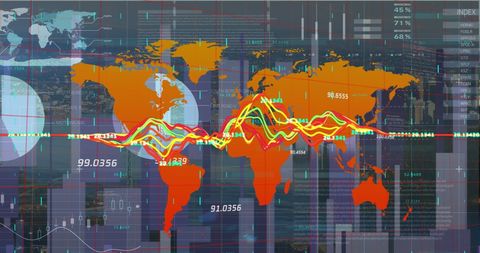
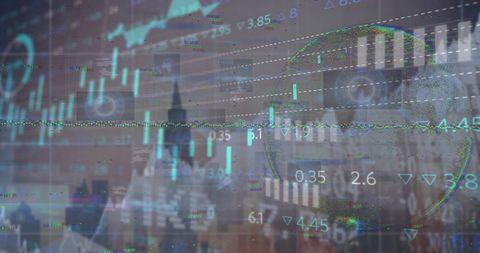
- Analyzing Complex Financial Data on Transparent Screen
Analyzing Complex Financial Data on Transparent Screen Image

Depicts an abstract representation of financial data analysis with fluctuating graphs and a digital interface. Suitable for illustrating concepts related to stock markets, financial trends, or economic reports. Ideal for use in presentations, articles, or websites related to finance and business technology.
Powered by 


downloads
Tags:
More
Credit Photo
If you would like to credit the Photo, here are some ways you can do so
Text Link
photo Link
<span class="text-link">
<span>
<a target="_blank" href=https://pikwizard.com/photo/analyzing-complex-financial-data-on-transparent-screen/b5a3971c122c3605b72cb5b2a43f9c92/>PikWizard</a>
</span>
</span>
<span class="image-link">
<span
style="margin: 0 0 20px 0; display: inline-block; vertical-align: middle; width: 100%;"
>
<a
target="_blank"
href="https://pikwizard.com/photo/analyzing-complex-financial-data-on-transparent-screen/b5a3971c122c3605b72cb5b2a43f9c92/"
style="text-decoration: none; font-size: 10px; margin: 0;"
>
<img src="https://pikwizard.com/pw/medium/b5a3971c122c3605b72cb5b2a43f9c92.jpg" style="margin: 0; width: 100%;" alt="" />
<p style="font-size: 12px; margin: 0;">PikWizard</p>
</a>
</span>
</span>
Free (free of charge)
Free for personal and commercial use.
Author: Awesome Content
Similar Free Stock Images

Premium


Premium


Premium


Premium


Premium


Premium


Premium


Premium


Premium


Premium


Premium

Premium


Premium


Premium


Premium


Premium


Premium

Premium


Premium

Premium


Premium


Premium

Premium


Premium


Premium

Explore More Free Stock Images