- Home >
- Stock Photos >
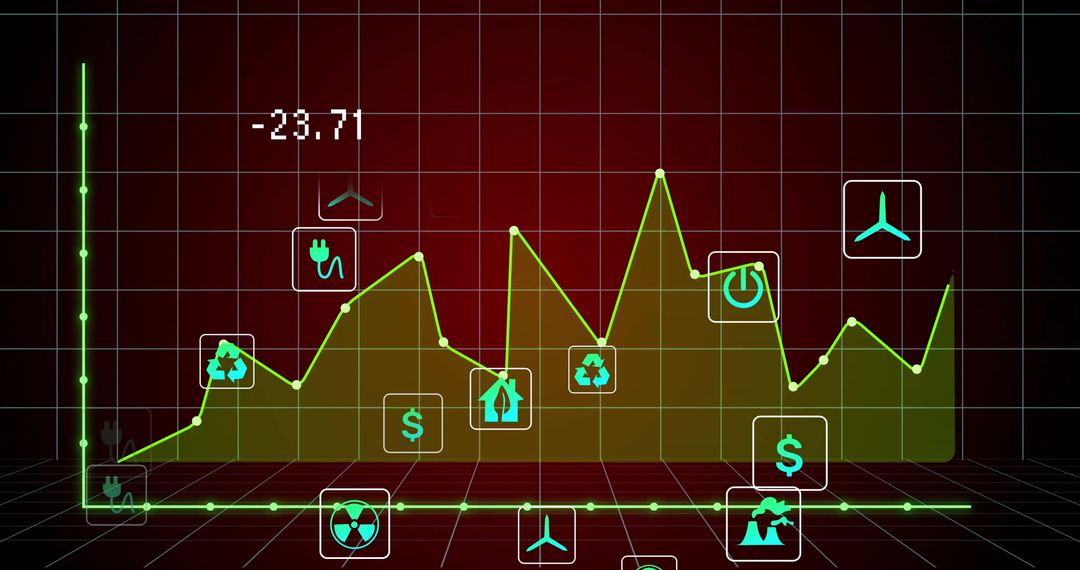
- Analyzing Data Graph on Laptop with Tools at Modern Workspace
Analyzing Data Graph on Laptop with Tools at Modern Workspace Image

Graphic highlights data analysis on a laptop, blending a transparent graph overlay with a modern work setting, suggesting technology-driven productivity. Perfect for blogs and presentations on business insights, electronic workspace organization, or professional efficiency training.
Powered by 


0
downloads
downloads
Tags:
More
Credit Photo
If you would like to credit the Photo, here are some ways you can do so
Text Link
photo Link
<span class="text-link">
<span>
<a target="_blank" href=https://pikwizard.com/photo/analyzing-data-graph-on-laptop-with-tools-at-modern-workspace/97496327fb88fb3149748b1d5047da50/>PikWizard</a>
</span>
</span>
<span class="image-link">
<span
style="margin: 0 0 20px 0; display: inline-block; vertical-align: middle; width: 100%;"
>
<a
target="_blank"
href="https://pikwizard.com/photo/analyzing-data-graph-on-laptop-with-tools-at-modern-workspace/97496327fb88fb3149748b1d5047da50/"
style="text-decoration: none; font-size: 10px; margin: 0;"
>
<img src="https://pikwizard.com/pw/medium/97496327fb88fb3149748b1d5047da50.jpg" style="margin: 0; width: 100%;" alt="" />
<p style="font-size: 12px; margin: 0;">PikWizard</p>
</a>
</span>
</span>
Free (free of charge)
Free for personal and commercial use.
Author: Creative Art
Similar Free Stock Images

Premium


Premium


Premium


Premium


Premium


Premium


Premium


Premium


Premium


Premium


Premium


Premium


Premium


Premium


Premium


Premium


Premium


Premium


Premium


Premium


Premium


Premium


Premium


Premium