1. Home > 
  2. Stock Photos > 
  3. Analyzing Data Graphs in Digital Network Environment

Analyzing Data Graphs in Digital Network Environment Image

Analyzing Data Graphs in Digital Network Environment

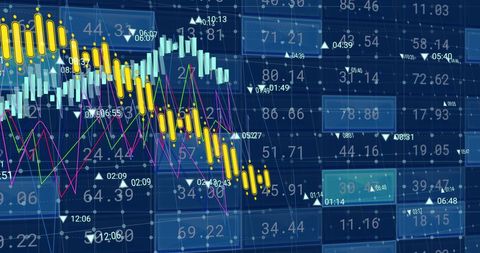
Visually engaging backdrop with digital graphs and data on a blue grid highlights data analysis in a digital setting. Ideal for illustrating technological developments in finance, analytics, and network connections. Useful for business presentations, tech blog graphics, and educational materials explaining global data interactions.

Powered by Adobe logo
Futuristic data analytics dashboard with global map, charts and graphs, visualizing user growth,server load and processing metrics in digital environment - Powered by AdobeA futuristic robotic hand interacts with vibrant data graphs and digital charts, emphasizing innovation in technology, finance, and data analysis in a modern setting. Copula - Powered by AdobeBusinesswoman working on laptop with analytics graphs displayed on screen inside warehouse. Concept of logistics, supply chain, inventory management, shipping, ecommerce and distribution. - Powered by AdobeEngineer in hard hat, safety glasses controls industrial production process. Uses tablet to monitor digital data on holographic interface with graphs. Modern smart factory automation tech with - Powered by AdobeDigital interface screens with glowing blue and orange data visualizations, charts and graphs conveying ai driven big data processing, cybersecurity monitoring and network intelligence - Powered by Adobe

Credit Photo

If you would like to credit the Photo, here are some ways you can do so

Free (free of charge)

Free for personal and commercial use.

Author: People Creations

Similar Free Stock Images

Financial Chart with Social Media Reaction Icons
Premium
Analyzing procurement data on tablet
Business Team Analyzing Financial Dashboard with Colorful Line, Bar and Pie Charts
Premium
Vibrant workspace showcasing data analysis with colorful charts and graphs on a large digital dashboard display
Dynamic Financial Data on Digital Interface
Digital Data Visualization with Abstract Bar Graphs
Digital Analytics Financial Market Interface Visualization
Digital Display of Financial Data Analytics and Graphs
Premium
Big data and AI technology, Business intelligence and AI data science, Automating data processing, Machine learning and business intelligence, AI driven data processing, KPI performance monitoring.
Financial Analytics with Dark Grid and Data Visualizations
Digital Stock Market Display with Graphs and Data Analytics
Abstract Digital Data Visualization
Premium
digital technology background for AI, data processing, audio, and modern graphics
Financial Analytics with Graphs and Data on Digital Interface
Digital Data Visualization on Global World Map
Encrypted waveform visualizing secure network traffic on futuristic digital dashboard UI
Financial Data Analytics with Environmental Sustainability Icons
Premium
Business growth concept with rising arrow and gear icons showing teamwork and process efficiency.
Financial Data Overlay with Business Growth Charts in Modern Cityscape
Healthcare Professional Examining Digital Data Analytics with Metrics Overlay
Financial Data Graph Overlay in Modern Office Environment
Digital Financial Statistics Data Display on Office Background
Abstract Digital Data Interface with Blue Background
Premium
The illustration shows a futuristic digital financial system with glowing displays, microchips, and stacks of currency, representing digital transactions and data processing.
Global Financial Data Analytics with Abstract Digital Concept
Digital Data Trends Overlaying Cityscape Indicating Business Growth
Financial Data Processing with Digital Icons over Blue Stock Market Background
Finance Analytics Dashboard with Graph Reports on Blue Grid
Premium
Business women and graphs on tablet screen for finance results, profit growth and budget review. Staff, team and digital with financial report, revenue stats and dividend comparison of risk assessment
Abstract Visualization of Financial Data and Digital Analysis
Financial Data Visualization on Digital Grid Backdrop
Financial Data Visualization with Dynamic Graphical Analysis
Futuristic Blue Data Dashboard Displaying Bar Chart and Percentage Metrics
Digital Data Overlay on World Map Representing Global Analytics
Financial Data Visualization in Blue with Dynamic Graphics
Blue Data Dashboard Displaying Chat Notification 95 Over Analytics, Bar and Pie Charts
Dynamic Stock Market Chart with Currency and Candlestick Graphs
Premium
Businessman using futuristic touchscreen interface with AI icons and analytics graphs,Digital transformation,technology innovation and enterprise data analysis concept
Premium
Futuristic holographic data hub with glowing blue towers and floating analytical dashboards displaying charts and graphs.
Complex Financial Data Visuals with Coding Elements and Charts
Digital Financial Data Visualizations with Abstract Green Waves
Abstract Financial Charts with City Skyline Overlay
Abstract Financial Data Chart with Circles and Bar Graphs
Financial Data Analysis with Charts and Graphs
Digital Data Visualization with Global Financial Trends
Analyzing Financial Data and Economic Trends Concept
Dynamic Financial Data View with Stock Market Trends and Graphs
Premium
AI summary technology concept with digital data visualization. Person using artificial intelligence tools to generate automated summaries, improving productivity and efficiency in data analysis tasks.
Futuristic Digital Code and Data Visualization Overlays
Premium
A business team engages in data analysis using digital tools in a modern office setting, showcasing graphs and charts for strategic decision-making. Axiom
Abstract Data Dashboard with Graphs and Charts
Abstract Financial Data Visualization in Digital Interface
Premium
Futuristic digital dashboard displays business growth metrics. Data visualization shows product lifecycle, market launch, end-of-life performance. Technology concept with chart graphs, cyber space
Premium
Futuristic digital interface overlaying a cityscape, showcasing data visualization and global connections.
Financial Data Charts in Blue Digital Interface Background
Displaying Neon Financial Candlestick and Bar Dashboard with Line Graphs and Halftone Grid
Dynamic Financial Data on Digital Display Canvas
6G Network Concept with Financial Graph Interface
Premium
A data analyst, immersed in the digital realm, gazes thoughtfully at a dynamic display of data visualizations, embodying the power of technology in modern business.
Global Business Growth with Statistical Graphs and World Map Background
Digitally Processed Global Business Data Visual on Blue Background
Abstract Financial Data on Digital Interface Grid Background
Digital Abstract of Business Growth Charts Over Urban Skyline
Financial Data Visualization with Team Collaboration in Modern Office
Premium
Project manager using stylus on tablet with hologram Gantt chart schedule interface. Business planning, timeline management, and digital workflow concept for corporate strategy efficiency.
Stock Market Graph Reflecting Financial Trends and Analysis
Premium
Business analysis reports with charts and graphs. Integrated content management platform. Digital document automation. Businessperson holding reports.
Financial Data Processing with Digital Graphs and Numbers
Financial Data with Trend Lines and Bar Charts
Financial Data Visualization with Dynamic Chart and Graph Display
Global Financial Data Visualization on Futuristic Dashboard
Premium
Hand of a businessman drawing graphs illustrates Business Intelligence as the process of gathering, reporting data to transform raw data into actionable insights that drive informed business decisions
Rising Graph with Data and Analysis Objects on Blue Background
Futuristic Data Analysis and Global Networking Interface
Digital Interface Showing Data Visualization with Analytics Charts
Premium
Laptop displays a brain scan with graphs and data, hinting at medical research in a lab setting
Digital Stock Market Financial Data Display
Digital Interface with Global Business Data Visualization
Digital Financial Data and Stock Market Charts
Global Finance Analysis with Digital Interface Overlay
Global Finances and Data Analysis with World Map Overlay
Global Financial Dashboard Showing Rising Analytics Trend Line Over Data Grid and Charts
Digital Dashboard with Data Analytics and Visualization
Global Stock Market Data Visualization on World Map Background
Visualizing Neon Financial Candlestick Chart with Cyan Volume Bars and Bollinger Bands
Financial Data Visualization with Bars and Pie Charts
Digital Stock Market Data with Financial Icons
Virtual Data Streams and Analytics Interface
Premium
Futuristic digital architecture showcasing advanced data processing elements and integrated circuit board design, symbolizing technological innovation and complex computing
Colorful Financial Data Analytics and Digital Graph
Futuristic Digital Analytics Dashboard Display with Data Visualization
Dynamic Data Dashboard with Global Analytics Visualization
Abstract Digital Financial Data Visualization with Stock Exchange Numbers
Premium
Data analysis process governance compliance controls business metrics performance monitoring digital dashboard analytics tools visual data
Global Financial Data Visualization with Charts and World Map
Financial Chart with Social Media Notifications Interface
Dynamic Digital Stock Market Data on Grid Background
3D Grid with Dynamic Financial Data Visualization
Global Statistical Data and Stock Market Analysis Display
Financial Data Processing Over Digital Grid
Digital Interface with World Map and Data Analytics Visualization
Physician Examining Infant with Data and Technology Overlays
Digital Interface Displaying Financial Data Charts and Graphs
Digital Stock Market Data and Price Graph Analysis
Digital Financial Data Analysis with Vibrant Graphs
Premium
Futuristic digital data center with illuminated cylinder and dynamic waveform graphs
Dynamic Financial Data Display with Stock Market Trends
Digital Data Analysis Display with Red Arrows and Graphs
Premium
Automated factory with robotic arms and digital efficiency displays industrial automation
DNA Strand Overlaying Global Data Patterns
Digital Dashboard Display with Data Visualization and Analytics Graphs
Financial Data Processing Over Digital Cityscape
Global Financial Statistics Over World Map with Market Data
Premium
Smartphone projecting holographic data analysis icons and a satellite in a dark digital technology environment
Global Data Flow and Digital Interface on World Map
Dynamic Stock Market Index with Financial Data Overlay
Global Stock Market Analysis with Digital Graph Overlay
Digitally Generated DNA Strand with Data Processing Elements
Premium
Abstract visualization of sound waves and digital data flow with vibrant equalizer bars representing information processing and technological progress concept
Abstract Financial Data Through Graphic Overlays
Global Financial Data and Analysis Interface
Financial Data Processing with Blue Background Overlay
Digital Bluebar Charts Overlay Sunny Room with Data Visuals
Premium
A person typing on a laptop with colorful flowchart icons coming out of it
Binary Codes Monitor with Stock Market Graphs in Motion
Explore More Free Stock Images