
- Home >
- Stock Photos >
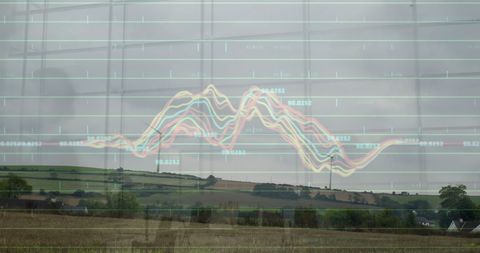
- Analyzing Data on a Dynamic Digital Grid
Analyzing Data on a Dynamic Digital Grid Image

Vibrant representation of dynamic digital grid showcasing data processing with colorful lines across a dark background. Useful for illustrations related to business data analysis, financial technology, and modern digital solutions in sports or global connectivity themes.
Powered by 


downloads
Tags:
More
Credit Photo
If you would like to credit the Photo, here are some ways you can do so
Text Link
photo Link
<span class="text-link">
<span>
<a target="_blank" href=https://pikwizard.com/photo/analyzing-data-on-a-dynamic-digital-grid/e3ab57e24edb867667095f555fc57406/>PikWizard</a>
</span>
</span>
<span class="image-link">
<span
style="margin: 0 0 20px 0; display: inline-block; vertical-align: middle; width: 100%;"
>
<a
target="_blank"
href="https://pikwizard.com/photo/analyzing-data-on-a-dynamic-digital-grid/e3ab57e24edb867667095f555fc57406/"
style="text-decoration: none; font-size: 10px; margin: 0;"
>
<img src="https://pikwizard.com/pw/medium/e3ab57e24edb867667095f555fc57406.jpg" style="margin: 0; width: 100%;" alt="" />
<p style="font-size: 12px; margin: 0;">PikWizard</p>
</a>
</span>
</span>
Free (free of charge)
Free for personal and commercial use.
Author: People Creations
Similar Free Stock Images
Premium


Premium

Premium


Premium


Premium


Premium

Premium

Premium

Premium


Premium


Premium


Premium

Premium


Premium


Premium


Premium


Premium


Premium

Premium


Premium

Premium


Premium


Premium


Premium


Premium


Explore More Free Stock Images