- Home >
- Stock Photos >
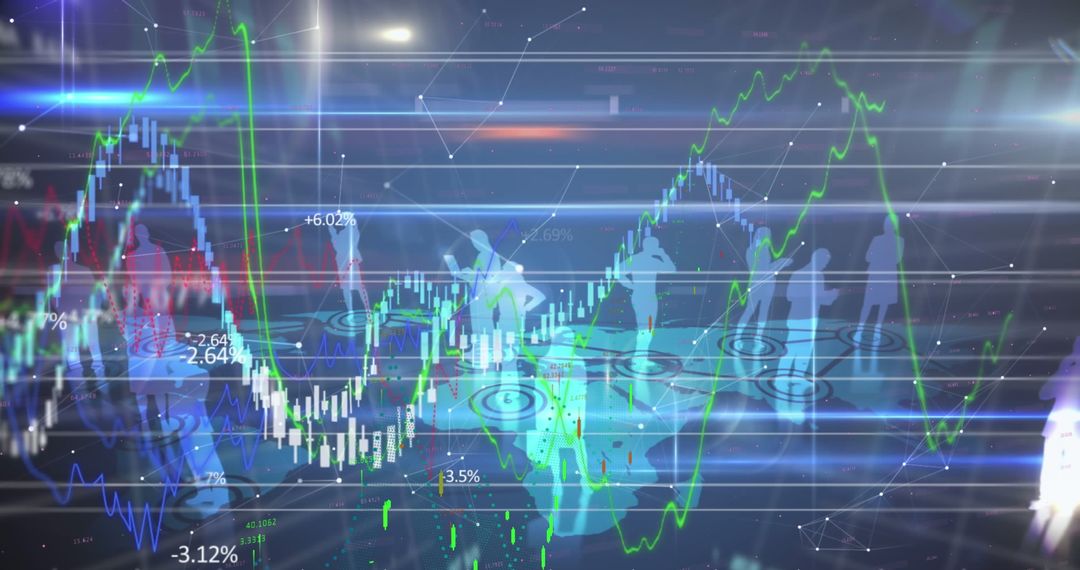
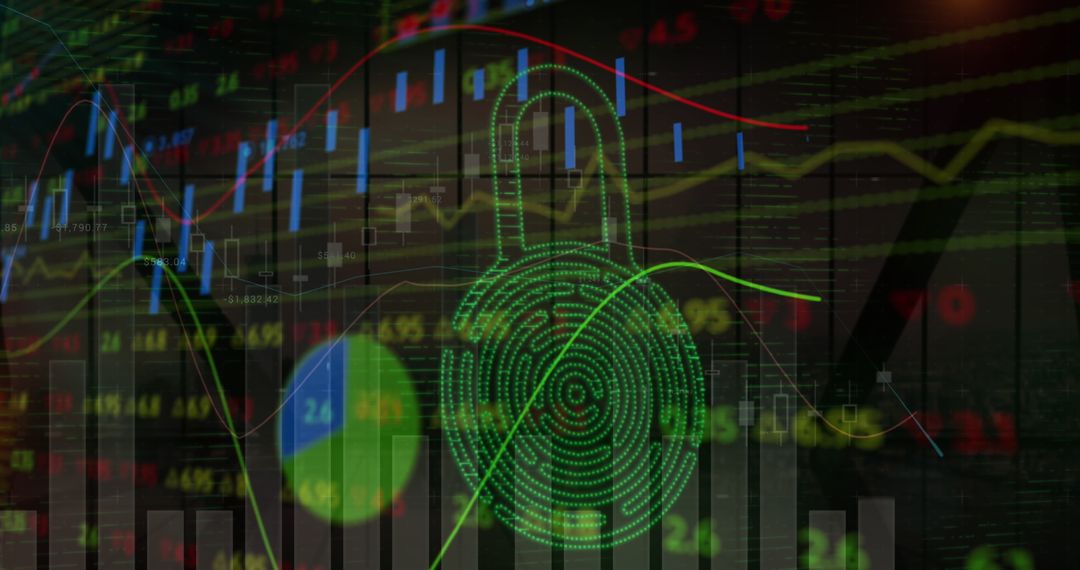
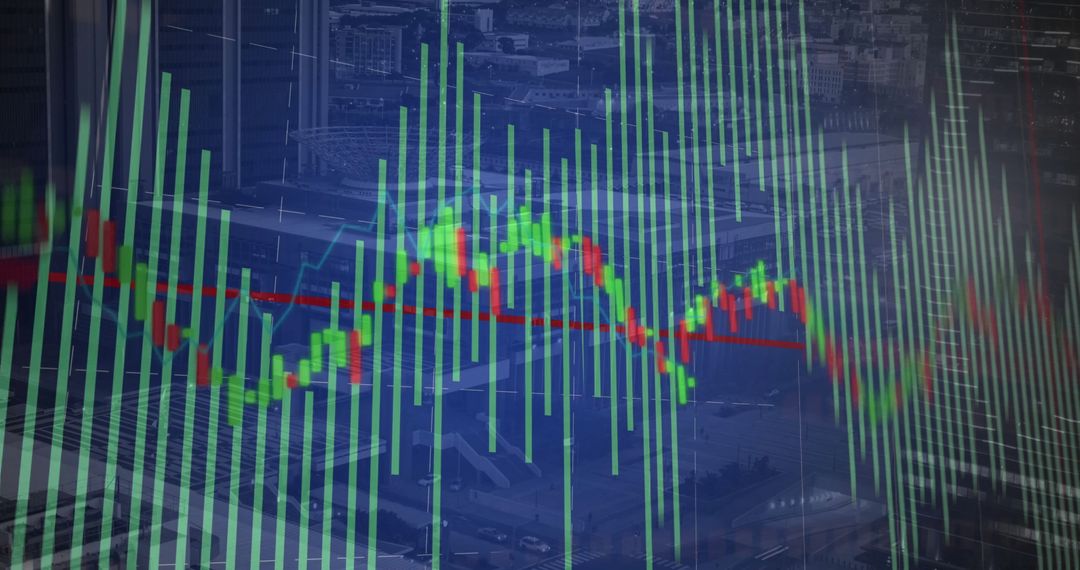
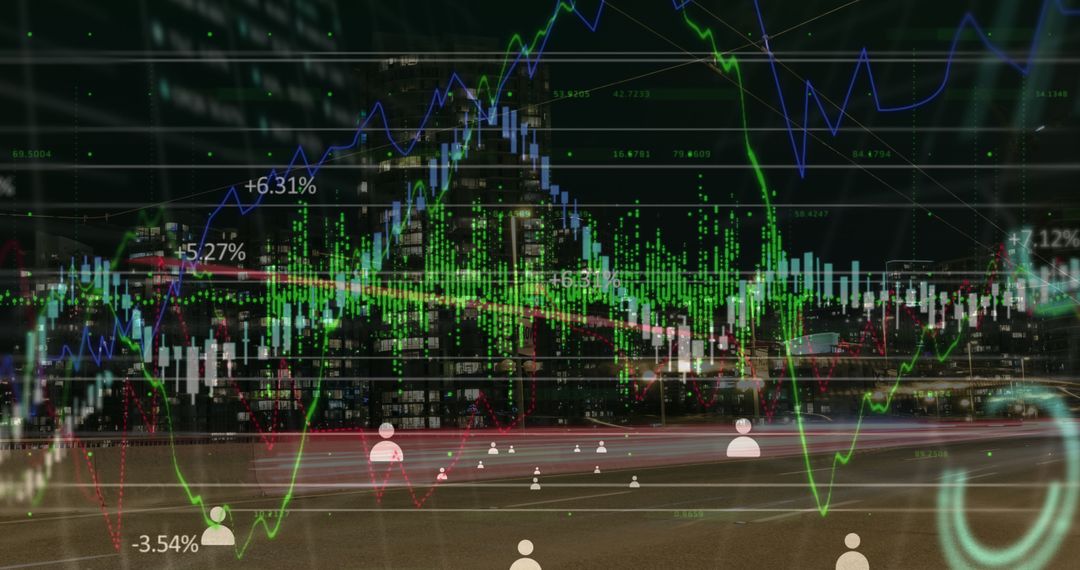
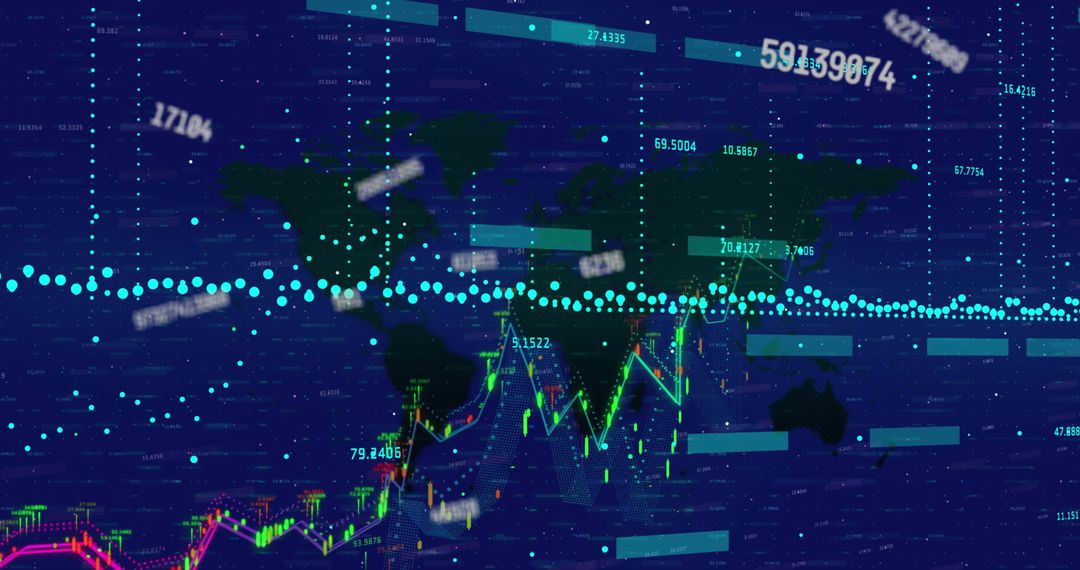
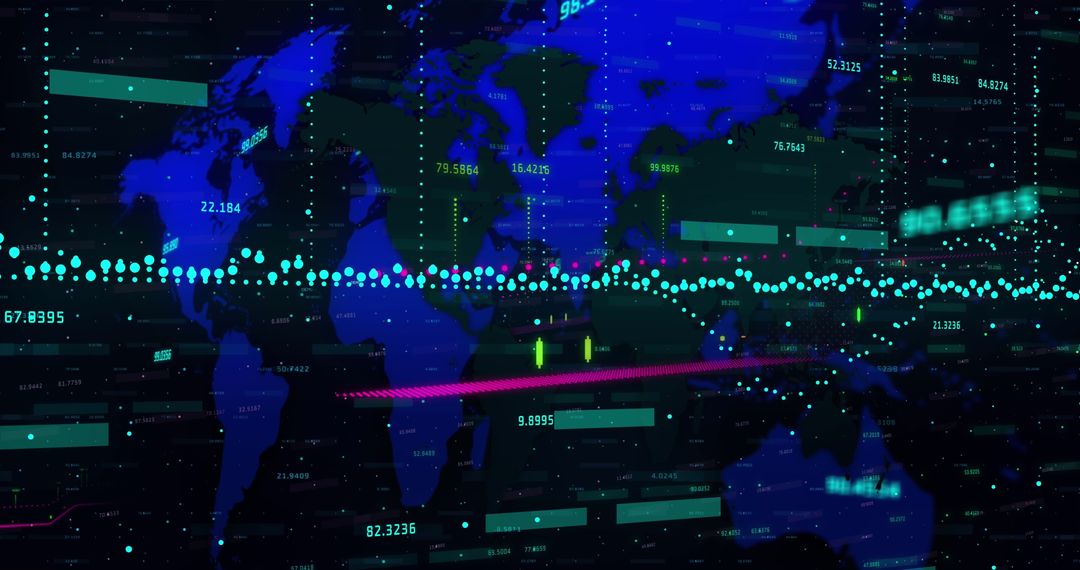
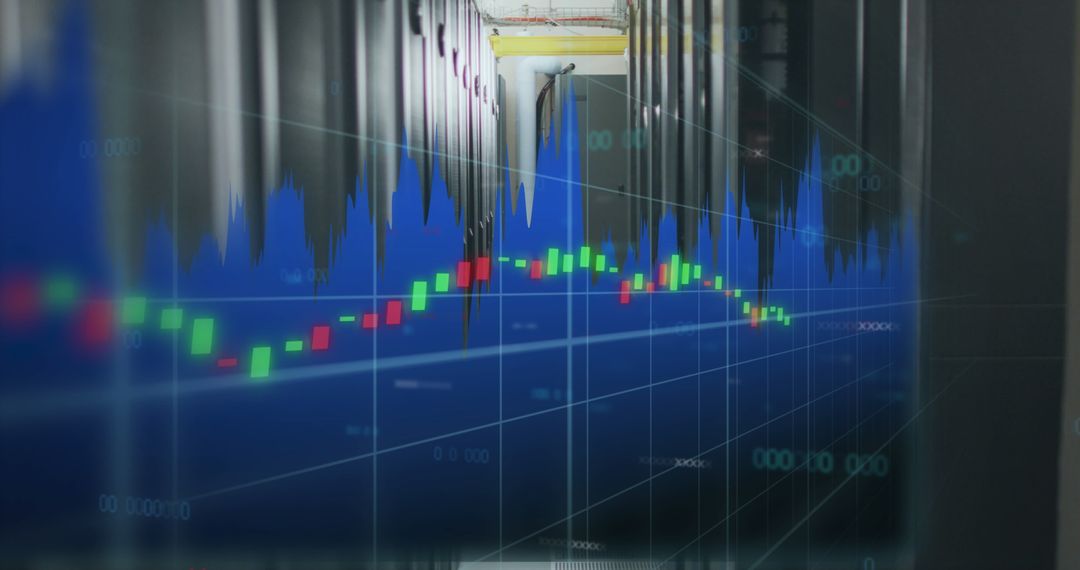
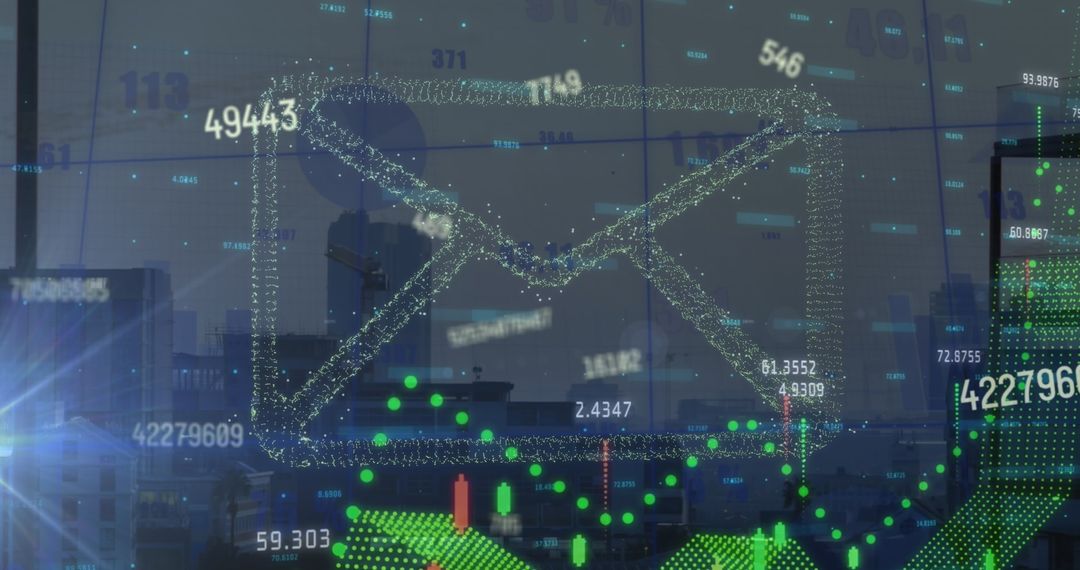
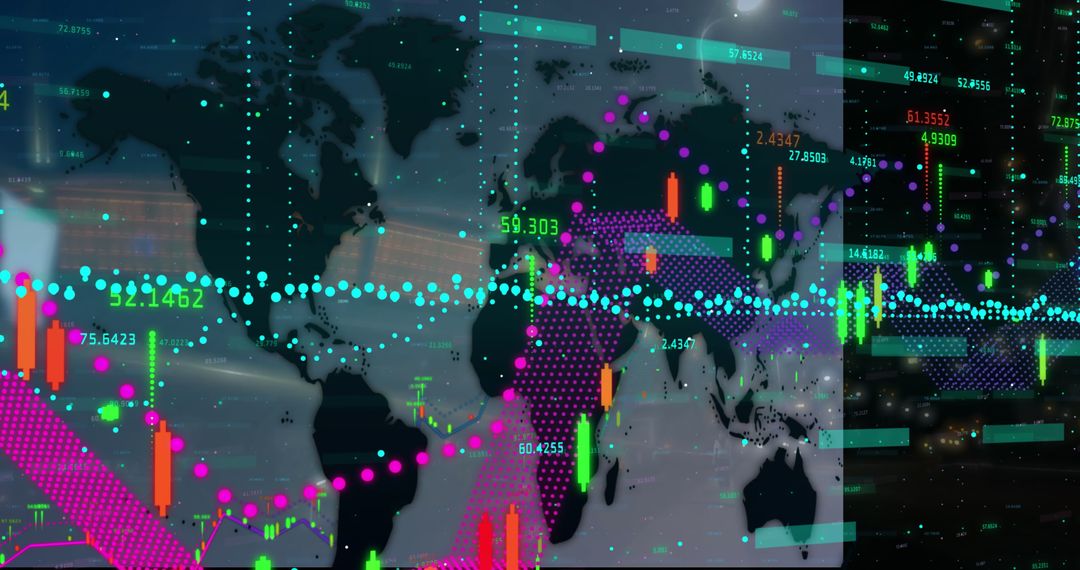
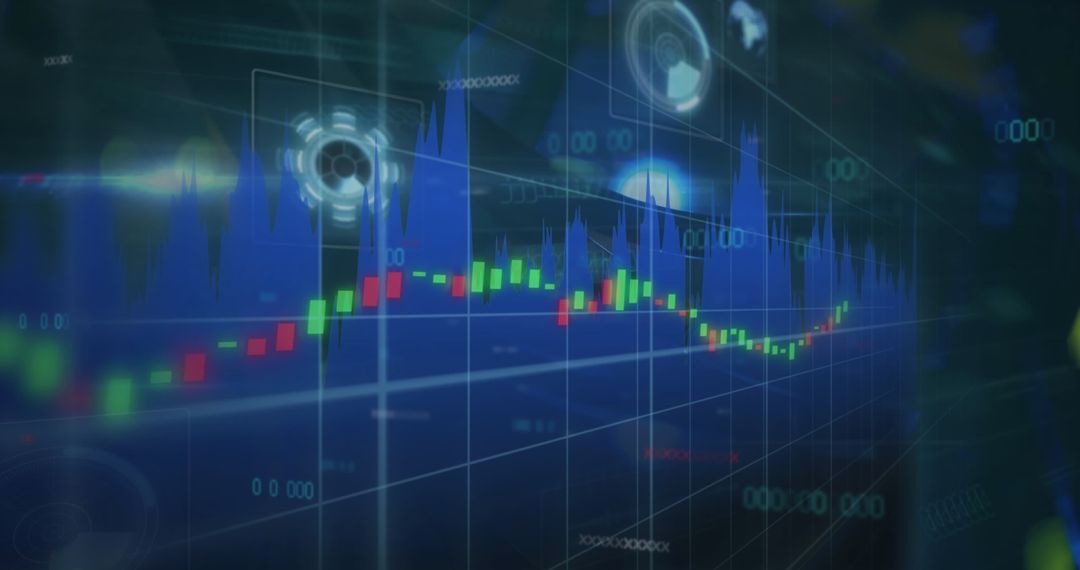
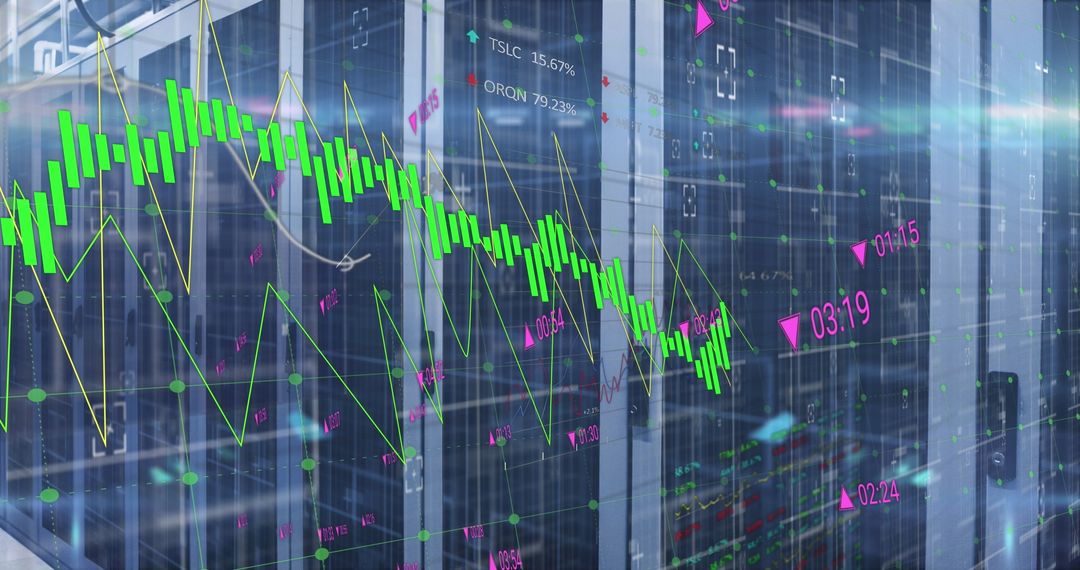
- Analyzing Data with Futuristic Financial Graphs and Holographic Displays
Analyzing Data with Futuristic Financial Graphs and Holographic Displays Image

This futuristic scene depicts holographic displays showing financial graphs and data analysis, ideal for conveying advanced technological concepts in finance and business settings. It is useful for articles or presentations on financial technology, innovative business solutions, investment strategy, and digital transformation in finance industries.
Powered by  - Get 15% off with code: PIKWIZARD15


2
downloads
downloads
Tags:
More
Credit Photo
If you would like to credit the Photo, here are some ways you can do so
Text Link
photo Link
<span class="text-link">
<span>
<a target="_blank" href=https://pikwizard.com/photo/analyzing-data-with-futuristic-financial-graphs-and-holographic-displays/d0f624e94c5f5edbcd6803889415616b/>PikWizard</a>
</span>
</span>
<span class="image-link">
<span
style="margin: 0 0 20px 0; display: inline-block; vertical-align: middle; width: 100%;"
>
<a
target="_blank"
href="https://pikwizard.com/photo/analyzing-data-with-futuristic-financial-graphs-and-holographic-displays/d0f624e94c5f5edbcd6803889415616b/"
style="text-decoration: none; font-size: 10px; margin: 0;"
>
<img src="https://pikwizard.com/pw/medium/d0f624e94c5f5edbcd6803889415616b.jpg" style="margin: 0; width: 100%;" alt="" />
<p style="font-size: 12px; margin: 0;">PikWizard</p>
</a>
</span>
</span>
Free (free of charge)
Free for personal and commercial use.
Author: People Creations
Similar Free Stock Images

Premium


Premium


Premium


Premium


Premium


Premium


Premium

Premium


Premium


Premium


Premium


Premium


Premium


Premium

Premium


Premium


Premium


Premium


Premium


Premium


Premium


Premium


Premium

Premium