
- Home >
- Stock Photos >
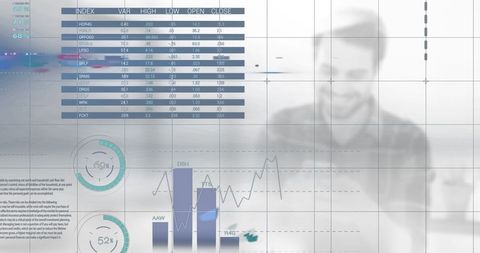
- Analyzing Digital Graphs Highlighting Financial Data Trends
Analyzing Digital Graphs Highlighting Financial Data Trends Image

Graphic representation showing digital charts and graphs for financial trends. Ideal for financial analysis topics, business intelligence presentations, investment forecasting, and statistics lessons. Useful for illustrating complex data in a limitless array of business and economics contexts.
Powered by 


downloads
Tags:
More
Credit Photo
If you would like to credit the Photo, here are some ways you can do so
Text Link
photo Link
<span class="text-link">
<span>
<a target="_blank" href=https://pikwizard.com/photo/analyzing-digital-graphs-highlighting-financial-data-trends/1bc896f8f0df7c54737a3cc7af4441e1/>PikWizard</a>
</span>
</span>
<span class="image-link">
<span
style="margin: 0 0 20px 0; display: inline-block; vertical-align: middle; width: 100%;"
>
<a
target="_blank"
href="https://pikwizard.com/photo/analyzing-digital-graphs-highlighting-financial-data-trends/1bc896f8f0df7c54737a3cc7af4441e1/"
style="text-decoration: none; font-size: 10px; margin: 0;"
>
<img src="https://pikwizard.com/pw/medium/1bc896f8f0df7c54737a3cc7af4441e1.jpg" style="margin: 0; width: 100%;" alt="" />
<p style="font-size: 12px; margin: 0;">PikWizard</p>
</a>
</span>
</span>
Free (free of charge)
Free for personal and commercial use.
Author: Creative Art
Similar Free Stock Images

Premium


Premium

Premium


Premium

Premium


Premium

Premium


Premium

Premium


Premium


Premium


Premium


Premium


Premium


Premium

Premium

Premium


Premium

Premium


Premium


Premium

Premium


Premium


Premium


Premium


Explore More Free Stock Images