- Home >
- Stock Photos >
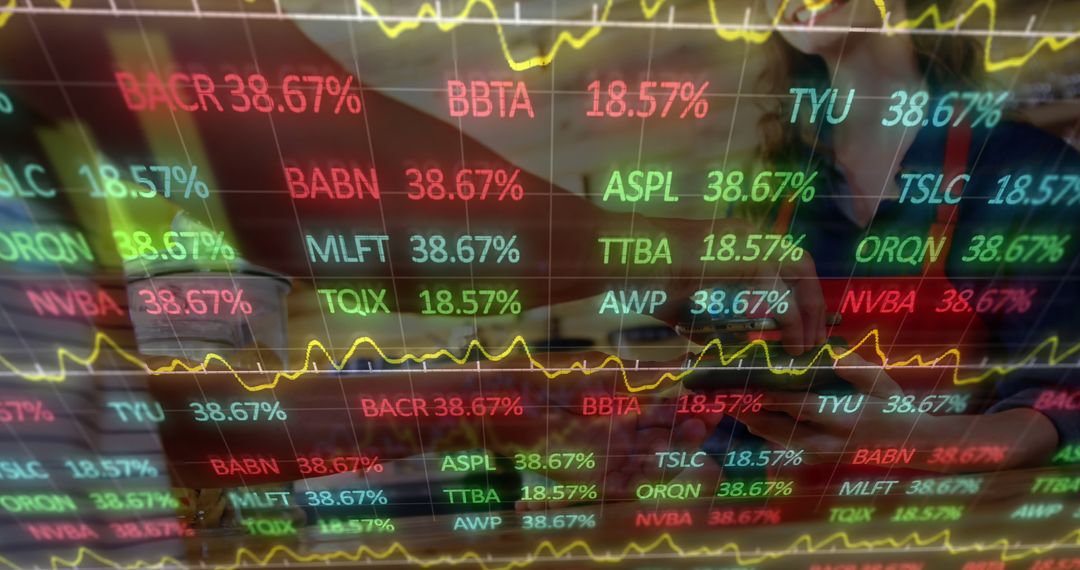
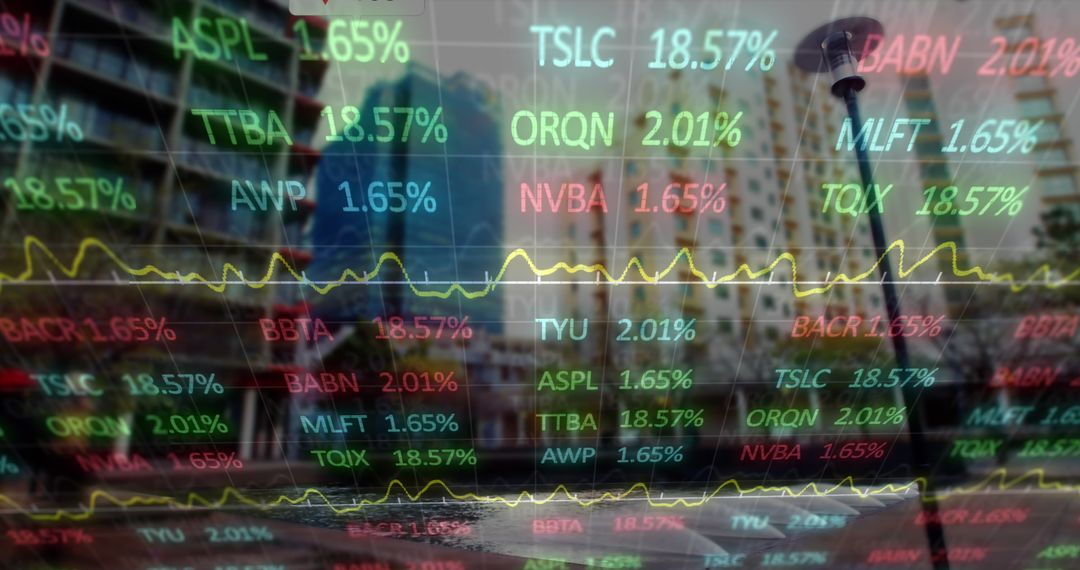
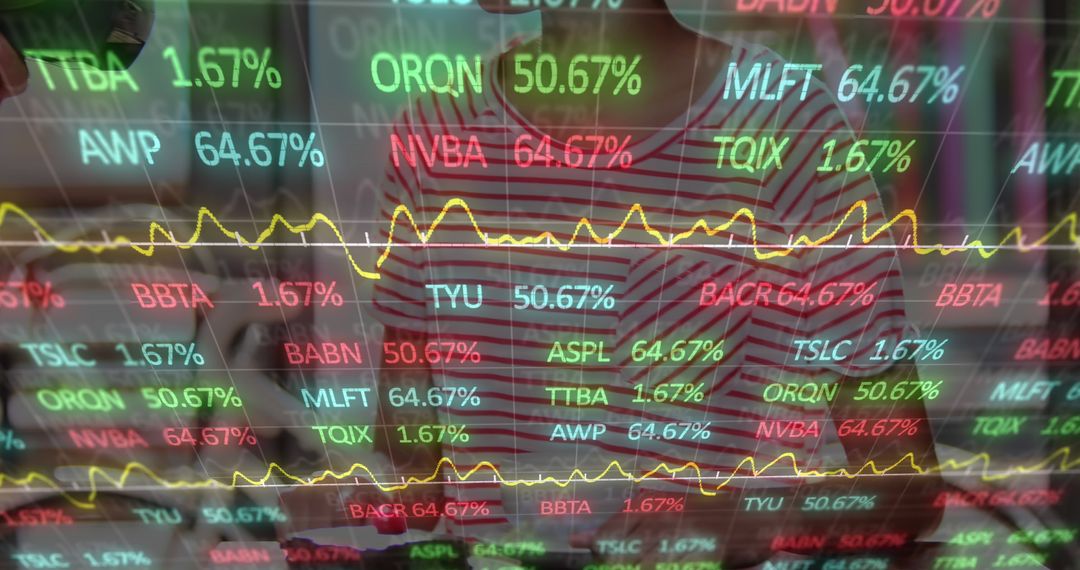
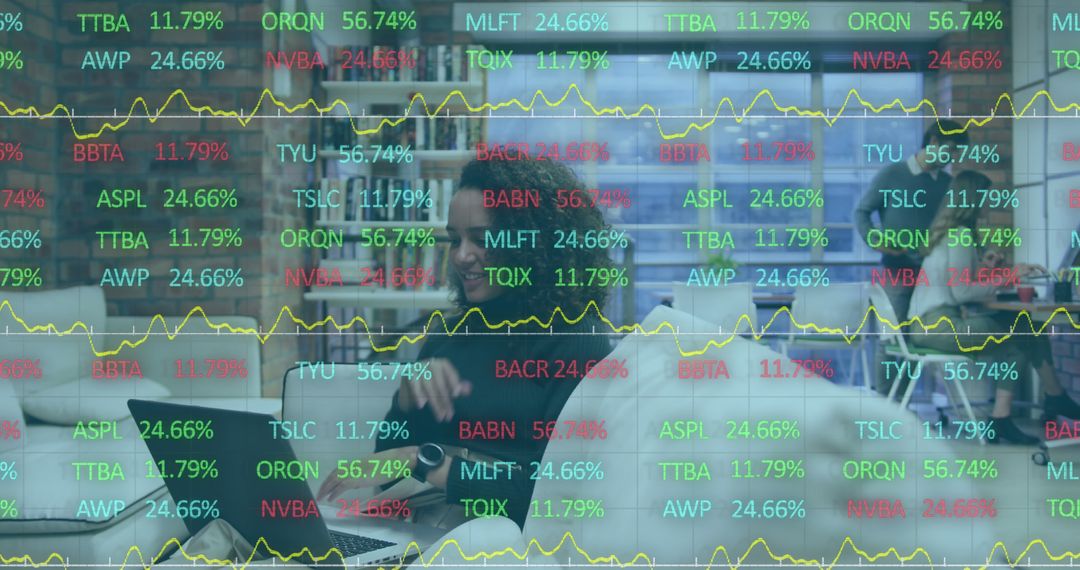
- Analyzing Digital Stock Market Data on Multiple Displays
Analyzing Digital Stock Market Data on Multiple Displays Image

Brightly colored numbers and graphs display stock data on a screen, reflecting activity in financial markets. Use this image to convey concepts related to investment analysis, market fluctuations, or economic reporting in business presentations and educational materials.
Powered by 


2
downloads
downloads
Tags:
More
Credit Photo
If you would like to credit the Photo, here are some ways you can do so
Text Link
photo Link
<span class="text-link">
<span>
<a target="_blank" href=https://pikwizard.com/photo/analyzing-digital-stock-market-data-on-multiple-displays/8de11117d82fc94513e7d4252c3be331/>PikWizard</a>
</span>
</span>
<span class="image-link">
<span
style="margin: 0 0 20px 0; display: inline-block; vertical-align: middle; width: 100%;"
>
<a
target="_blank"
href="https://pikwizard.com/photo/analyzing-digital-stock-market-data-on-multiple-displays/8de11117d82fc94513e7d4252c3be331/"
style="text-decoration: none; font-size: 10px; margin: 0;"
>
<img src="https://pikwizard.com/pw/medium/8de11117d82fc94513e7d4252c3be331.jpg" style="margin: 0; width: 100%;" alt="" />
<p style="font-size: 12px; margin: 0;">PikWizard</p>
</a>
</span>
</span>
Free (free of charge)
Free for personal and commercial use.
Author: People Creations
Similar Free Stock Images

Premium


Premium


Premium


Premium


Premium


Premium


Premium


Premium


Premium


Premium


Premium


Premium


Premium


Premium


Premium


Premium


Premium


Premium


Premium


Premium


Premium


Premium


Premium


Premium