1. Home > 
  2. Stock Photos > 
  3. Analyzing Dynamic Financial Data with Green Stock Market Trends

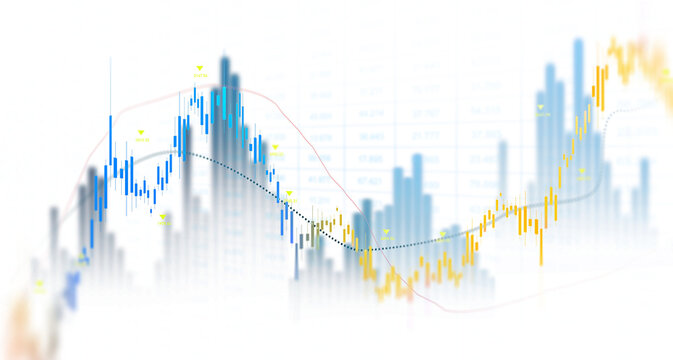
Analyzing Dynamic Financial Data with Green Stock Market Trends Image

Analyzing Dynamic Financial Data with Green Stock Market Trends

Captures fluctuating stock market trends and financial data analysis with glowing green graphics. This eyecatching visualization is perfect for techno-financial sectors aiming to illustrate market analysis, investment opportunities, or economic studies in dynamic presentations or reports.

Powered by Adobe logo
Futuristic digital dashboard with glowing stock market graphs and blurred city skyline background reflecting advanced finance technology and data analytics - Powered by AdobeTransparent or png stock market investment trading graph growth.Trade business analytics graph and financial chart.	
 - Powered by AdobeMagnifying glass reveals detailed stock market candlestick chart on financial report, symbolizing investment analysis and business growth. Ai Generated Images - Powered by AdobeProfessional Latina woman sits at desk in coworking office, focused on her work, looking at computer screen displaying financial charts and stock market data related to trading or financial analysis - Powered by AdobeA businessman in a suit watches stock market data on a large monitor in a modern office while analyzing financial graphs and charts displayed. - Powered by Adobe

Credit Photo

If you would like to credit the Photo, here are some ways you can do so

Free (free of charge)

Free for personal and commercial use.

Author: Awesome Content

Similar Free Stock Images

Futuristic Stock Market Graph with Digital Data
Premium
A close-up, macro shot of a black pen tip touching a red line on a digital screen displaying stock market data with green and orange glowing elements and bokeh
Futuristic Digital Data Analytics Interface Display
Digital Graph with Arrow and Numerical Increase Concept
Abstract Digital Interface with Data Processing Over Cardiograph
Financial Data and Statistics Display with Rising Arrows
Premium
Analyzing financial growth charts for strategic business decisions and investment opportunities, envisioning success with data-driven insights and projections
Stagflation Represented in Digital Data Display
Digital Inflation Visualization with Stock Market Data Overlay
Slumpflation Concept with Digital Data and Charts
Digital Ecology Icons in Futuristic Data Display
Premium
Business person analyzing financial graphs, symbolizing market growth, investment strategies, and economic development. Concepts of stock trends, Corporate finance, future planning, and data analytics
Stock Trends Overlaid on Modern Cityscape Symbolizing Global Business
Digital Data Overlay on Urban Skyline Examining Global Business Trends
Digital Fintech Interface with Global Business Network
Dynamic Global Market Trends Over World Map Visualization
Premium
Close up of a finger touching a digital financial stock market graph on a screen
Financial Data Overlay on Urban Construction Background
Abstract Data Visualization Overlaying Urban Cityscape
Dynamic Stock Market Graph with Green Arrows and Numbers
Abstract Stock Market Data with Growing Graph
Premium
Dynamic stock market chart with vibrant blue and pink bars showing upward trend and financial data visualization in a futuristic digital interface
Dynamic Green Stock Market Chart with Upward Arrows
Financial Data Overlay on Scrolling Digital Stock Market Data
Upward Stock Market Arrow with Binary Code Background
Abstract Circuit Brain with Financial Growth Concept
Premium
Stock market investment trading graph growth.Trade business analytics graph and financial chart.Finance chart,stock market business and exchange financial growth graph.
Financial Data Analysis with Dynamic Green Charts in Background
Futuristic Neon-blue ECG Waveform amid Streaming Binary Code
Dynamic Financial Charts Displaying Market Trends
Virtual Data Tunnel with Neon Streaming Numbers and Waveforms
Digital Financial Market Data Visualization
Data Transmission Over Server Room with Digital Overlay
Premium
Businessman hand holding virtual glowing arrow up icon, representing business growth, financial performance, investment success and positive economic trend with percentage symbols.
Declining Stock Market Graph on Digital Background
Dynamic Financial Growth Arrow with Data Overlay
Dynamic Digital Graph with Financial Data Trends
Dynamic Stock Market Trading with Green Data Graphs
Premium
Financial data graph with rising and falling trends in vibrant colors
Inflation Graph with Data Code Overlay on Digital Screen
Digital Green Financial Graph Overlay with Coding Elements
Digital Stock Data Overlay in Modern Server Room
Data Processing and Stagflation Concept with NATO Emblem
Premium
Financial market crash with red downward arrow and graphs indicating global economic recession and business investment losses on digital screen.
Digital Finance Data Overlapping Urban Skyline
Rising Digital Graph Overlay on City Skyline at Dusk
Stock Market Graphs Overlaying Urban Cityscape at Dusk
Stagflation Concept with Fluctuating Financial Graph and Data
Premium
Magnifying glass focusing on financial chart with coins, symbolizing investment analysis and market trends, evoking curiosity and insight
Dynamic Stock Market Graphs Over Digital Interface
Data Analysis in COVID-19 Medical Research with Molecular Visuals
Digital Interface with Business Graph and Silhouettes
Digital Simulated Global Financial Data and Graphs
Premium
Business growth and financial success illustrated by a rising stock market graph
Glowing Financial Graph of Stock Market Trends on Digital Screen
Binary Code Data Over Financial Graph with Red Trends
Futuristic AI and Binary Code Digital Graphic
Abstract Binary Code Wave on Digital Data Processing Grid
Premium
Stock market financial chart features blue candlesticks on a dar
Futuristic Neon Data Dashboard with Vibrant Analytics Tooltip
Financial Analyst Using Technology with Chart Overlay at Corporate Office
IT technician monitoring server racks with green waveform overlay in datacenter corridor
Dynamic Financial Graph on Digital Grid in Stock Market Analysis
Cybersecurity Concept with Green Digital Shield and Padlock
Rising Market Trends Green Arrow Chart with Numbers
Premium
Advanced robotic assistants working in a modern office analyzing financial data on computer screens with stock market graphs
Abstract Financial Data with Upward Arrows on Digital Background
Rising Financial Data and Graph with Arrows
Futuristic Digital Programming and Wave Patterns Hologram
Stagflation Concept with Digital Data and Graph
Premium
A luminous digital human brain is intersected by an ascending blue financial graph, symbolizing intellectual growth, market progress, and strategic development.
Ecology Icons on Digital Data Wave Interface
Abstract Financial Data Visualization in Server Room
Dynamic Financial Data Over Dollar Symbols Background
Digital Financial Data Overlay on Urban Buildings
Premium
Financial market data analysis with glowing 3D bar and line charts on dark background showing economic trends and growth concept visualization. 3D Rendering
Dynamic Stock Market Graph Displaying Surging Growth
Global Data Analytics and Stock Market Visual Interface
Inflation Impact with Graphs and Data Overlays in Green
Dynamic Digital Financial Charts Overlaid with Traditional Dashboard Elements
Premium
Dynamic digital financial graph with glowing purple and blue trend lines on dark background displaying market analytics data for investment technology
Digital Financial Data Chart with Green Statistics
Dynamic Data Visualization with Financial and Technological Elements
World Map with Digital Financial Data Visualization
Digital Financial Analysis with Glowing Green Charts
Premium
Businesswoman typing on laptop with digital financial chart overlay, representing data analysis, stock market trends, economic growth, investment, business strategy, and modern technology.
Financial Data Analytics with Dynamic Green Arrows
Digital Financial Chart Overlay on Modern City Skyline
Businessman Using VR in Data Center with Virtual Graph Overlay
Binary Code Overlaying Futuristic Tropical Plants in Digital Setting
Premium
Rising financial graph with glowing data lines showing market growth trends
Business Professionals Analyzing Stock Trends with Digital Financial Charts
Displaying finance dashboard with teal upward trend, 3D arrow, candlesticks and analytics
Digital Data and Cloud Computing with Green Light Effects
Dynamic Data Waves on Digital Grid
Dynamic Growth Chart with Rising Arrows in Green Tones
Rising Financial Market Trends with Data Visualization
Premium
The magnifying glass highlighting financial data and market trends on paper.
Dynamic Financial Data Display with Rising Graph
Green Stock Market Chart with Rising Trend Line
Rising Inflation and Data Analysis in Business Finance
Financial Market Analysis in Digital Interface with Upward Graph
Premium
Close up of a person s hand holding a glowing futuristic holographic projection of a rising stock market graph and financial data
Digital Financial Data on Server with Stock Market Graph
Digital Finance Interface with Data Processing Elements
Digital Stock Market Data Overlaid on City Buildings
Digital Data Streams with Statistics Display
Premium
Sales data analysis dashboard showing performance, trends, and insights. Sales data tracks growth, supports decisions, sales data boosts strategy, and sales data drives performance. Latch
Server Network Analytics with Data Visualization Overlay
Futuristic Digital Interface with Dynamic Financial Graph
Futuristic Binary Code and Financial Data Visualization
Analytics Graph Overlay on Modern Data Center
Premium
Red stock market graph, financial data analytics, business loss
Colorful Financial Data Analytics and Global Market Trends
Data Visualization of Financial Market with Dots and Lines
Financial Data Processing Over Computer Servers
Financial Data Processing with Green Digital Graph in Action
Premium
Financial market analysis with stock graph overlay and industrial skyline at dusk
Abstract Binary Code with Digital Wave Patterns
Global Finance and Data Analytics in Server Environment
Digital Data Visualization with Green Globe and Modern Structures
Rising Market Trends with Green Line Graph and Arrow Indicators
Premium
Global market trends with vibrant financial analytics on a futuristic globe showing worldwide economy and stock exchange data analysis
Glitched stock market chart overlaying currency note, displaying volatility and digital data