- Home >
- Stock Photos >
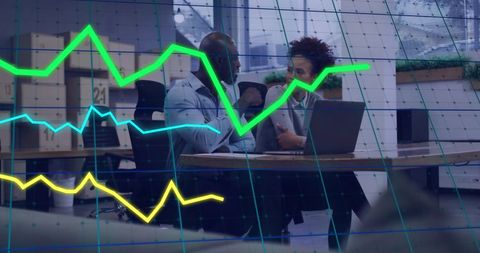
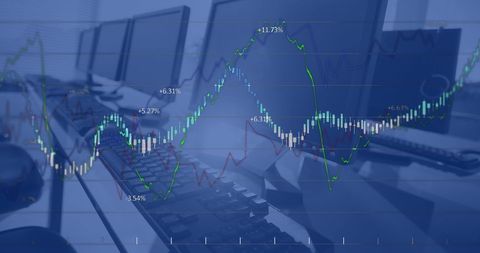
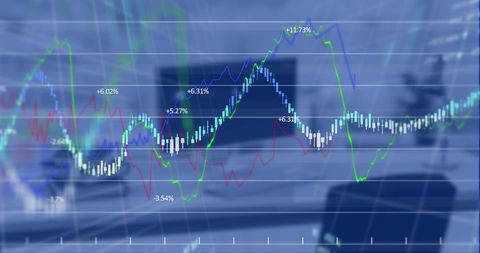
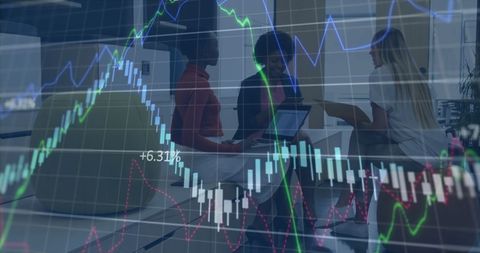
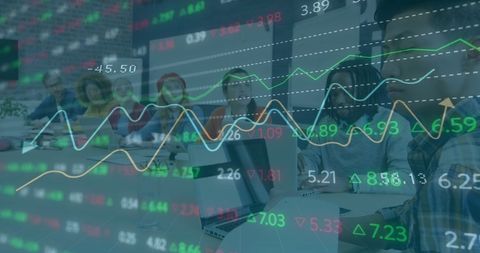
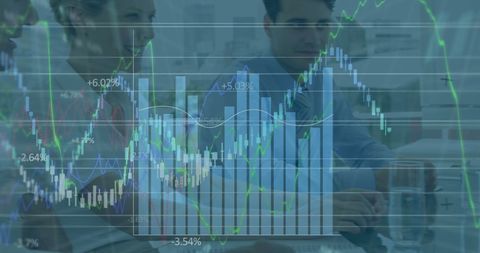
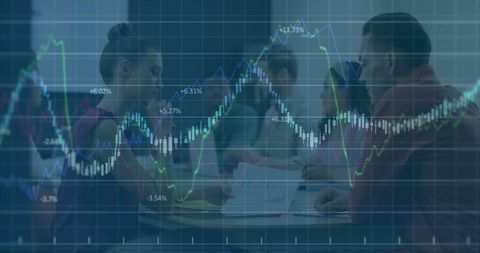
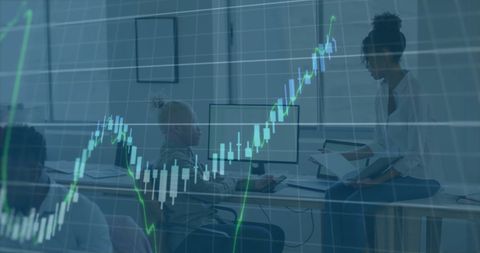
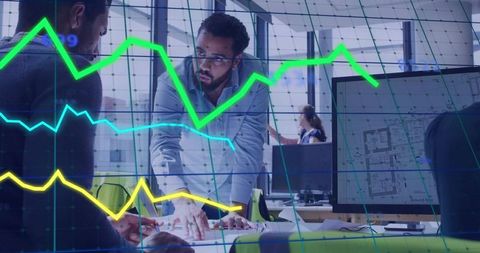
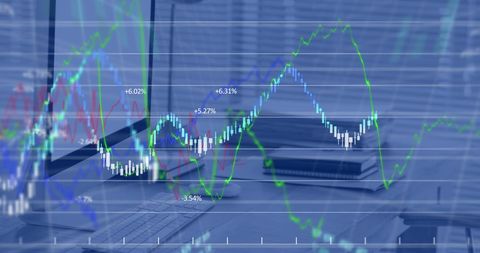
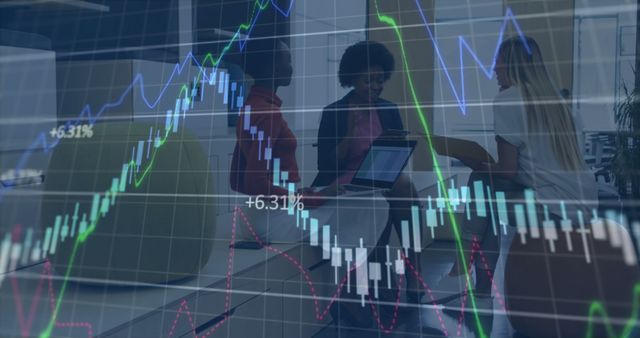
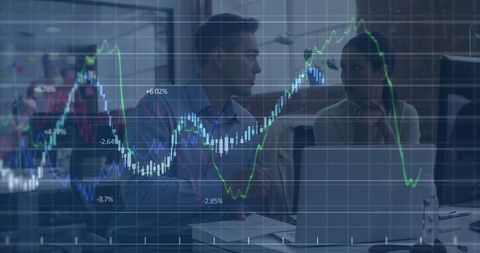
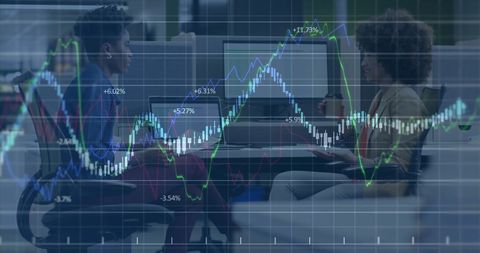
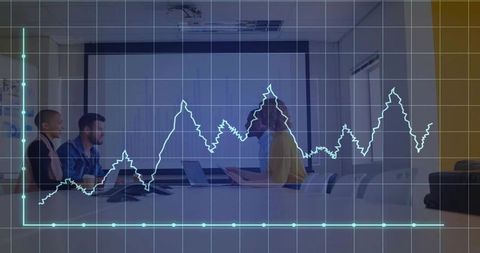
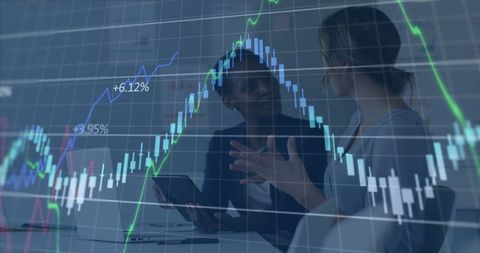
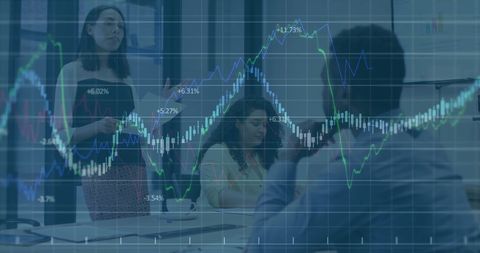
- Analyzing Financial Data in a Business Technology Office
Analyzing Financial Data in a Business Technology Office Image

Financial data overlays office environment equipped with computer screens, conveying concept of analyzing market changes and investment strategies. Use in presentations on finance, stock market insights, or product offerings associated with business technology services.
Powered by  - Get 15% off with code: PIKWIZARD15


downloads
Tags:
More
Credit Photo
If you would like to credit the Photo, here are some ways you can do so
Text Link
photo Link
<span class="text-link">
<span>
<a target="_blank" href=https://pikwizard.com/photo/analyzing-financial-data-in-a-business-technology-office/f4a3f302f0bc69b9861c0abedfb78757/>PikWizard</a>
</span>
</span>
<span class="image-link">
<span
style="margin: 0 0 20px 0; display: inline-block; vertical-align: middle; width: 100%;"
>
<a
target="_blank"
href="https://pikwizard.com/photo/analyzing-financial-data-in-a-business-technology-office/f4a3f302f0bc69b9861c0abedfb78757/"
style="text-decoration: none; font-size: 10px; margin: 0;"
>
<img src="https://pikwizard.com/pw/medium/f4a3f302f0bc69b9861c0abedfb78757.jpg" style="margin: 0; width: 100%;" alt="" />
<p style="font-size: 12px; margin: 0;">PikWizard</p>
</a>
</span>
</span>
Free (free of charge)
Free for personal and commercial use.
Author: Creative Art
Similar Free Stock Images
Loading...

Premium


Premium


Premium


Premium


Premium


Premium

Premium


Premium


Premium


Premium


Premium


Premium


Premium


Premium


Premium


Premium


Premium


Premium

Premium


Premium


Premium

Premium


Premium


Premium


Premium