
- Home >
- Stock Photos >
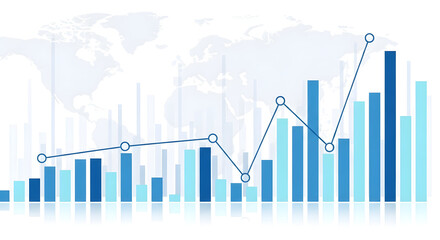
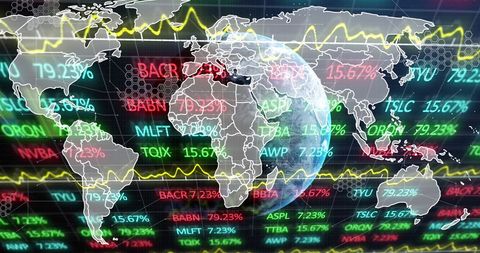
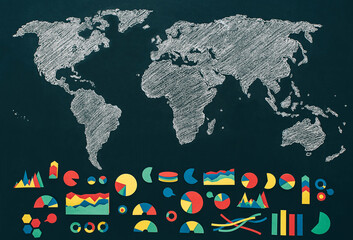
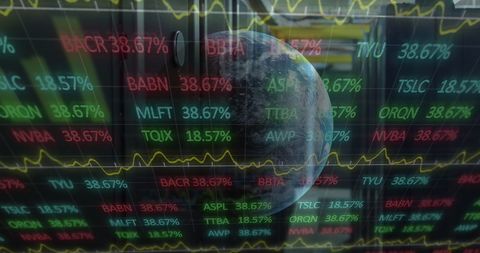
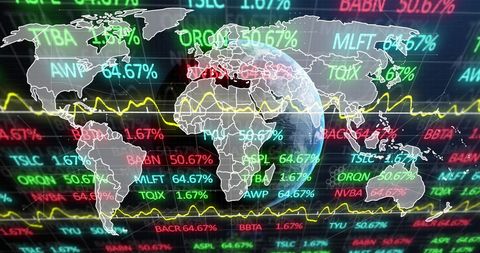
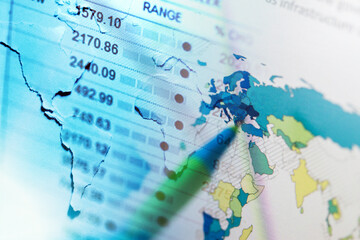
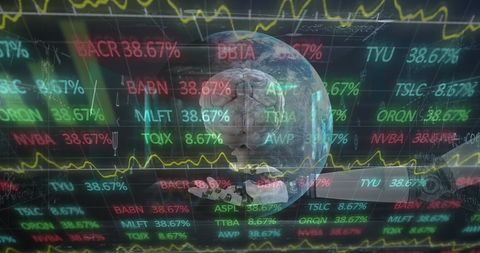
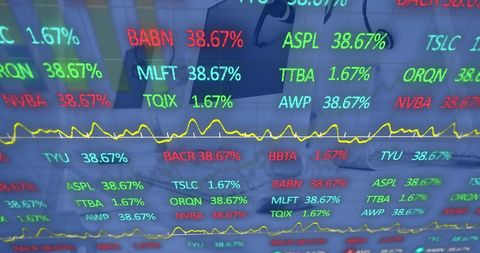
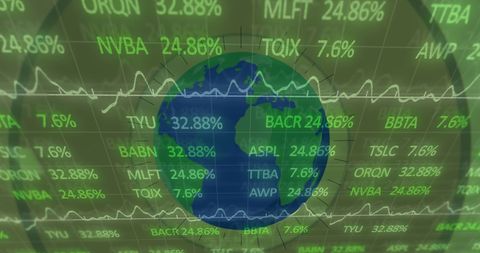
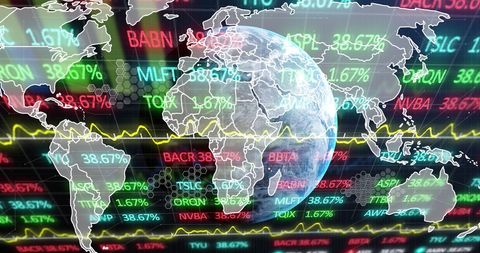
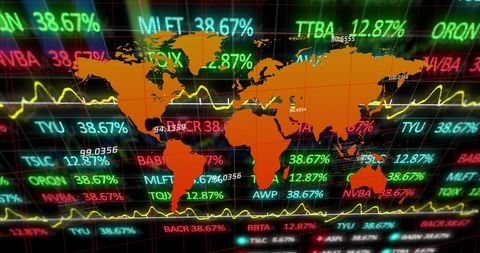
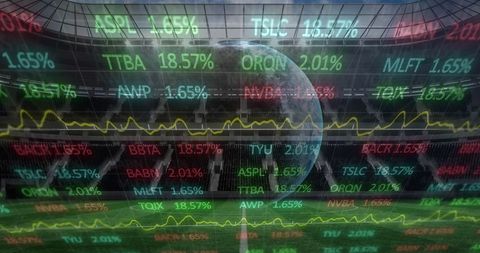
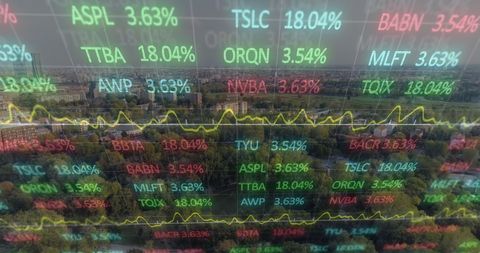
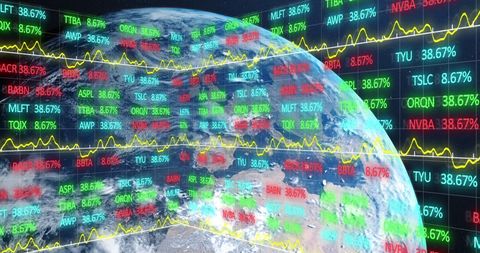
- Analyzing Financial Data Over World Map
Analyzing Financial Data Over World Map Image

This illustration shows detailed financial graphs superimposed on a world map. It signifies global business connections and the impact of technology on financial markets. Ideal for use in presentations or articles about financial analysis, global market trends, and innovative business solutions.
Powered by 


downloads
Tags:
More
Credit Photo
If you would like to credit the Photo, here are some ways you can do so
Text Link
photo Link
<span class="text-link">
<span>
<a target="_blank" href=https://pikwizard.com/photo/analyzing-financial-data-over-world-map/b63be0400f0382cb27a8f222458e7ec9/>PikWizard</a>
</span>
</span>
<span class="image-link">
<span
style="margin: 0 0 20px 0; display: inline-block; vertical-align: middle; width: 100%;"
>
<a
target="_blank"
href="https://pikwizard.com/photo/analyzing-financial-data-over-world-map/b63be0400f0382cb27a8f222458e7ec9/"
style="text-decoration: none; font-size: 10px; margin: 0;"
>
<img src="https://pikwizard.com/pw/medium/b63be0400f0382cb27a8f222458e7ec9.jpg" style="margin: 0; width: 100%;" alt="" />
<p style="font-size: 12px; margin: 0;">PikWizard</p>
</a>
</span>
</span>
Free (free of charge)
Free for personal and commercial use.
Author: Creative Art
Similar Free Stock Images

Premium

Premium

Premium


Premium


Premium
Premium


Premium


Premium


Premium


Premium

Premium

Premium


Premium


Premium


Premium

Premium


Premium


Premium

Premium


Premium


Premium

Premium


Premium


Premium


Premium

Explore More Free Stock Images