
- Home >
- Stock Photos >
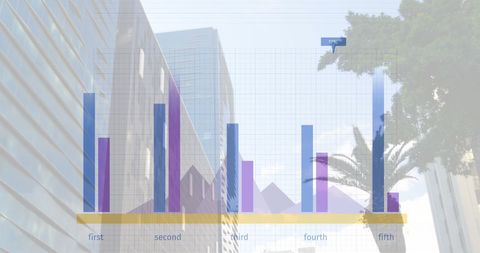
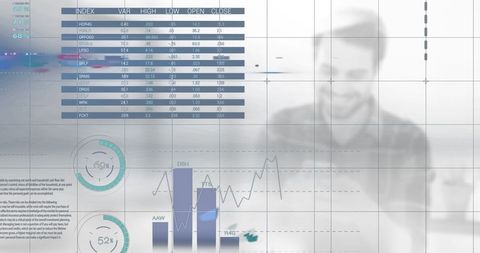
- Analyzing Financial Data Reports with Graphs and Stats
Analyzing Financial Data Reports with Graphs and Stats Image
Digitally generated image showcasing various financial graphs and statistics, ideal for presentations or content related to business analysis and global strategies. Useful for illustrating data science techniques in finance or enhancing reports about investments.
Powered by  - Get 15% off with code: PIKWIZARD15


downloads
Tags:
More
Credit Photo
If you would like to credit the Photo, here are some ways you can do so
Text Link
photo Link
<span class="text-link">
<span>
<a target="_blank" href=https://pikwizard.com/photo/analyzing-financial-data-reports-with-graphs-and-stats/bf5ac515d659ff5a818b91fb53c7e487/>PikWizard</a>
</span>
</span>
<span class="image-link">
<span
style="margin: 0 0 20px 0; display: inline-block; vertical-align: middle; width: 100%;"
>
<a
target="_blank"
href="https://pikwizard.com/photo/analyzing-financial-data-reports-with-graphs-and-stats/bf5ac515d659ff5a818b91fb53c7e487/"
style="text-decoration: none; font-size: 10px; margin: 0;"
>
<img src="https://pikwizard.com/pw/medium/bf5ac515d659ff5a818b91fb53c7e487.jpg" style="margin: 0; width: 100%;" alt="" />
<p style="font-size: 12px; margin: 0;">PikWizard</p>
</a>
</span>
</span>
Free (free of charge)
Free for personal and commercial use.
Author: Creative Art
Similar Free Stock Images

Premium


Premium


Premium


Premium


Premium


Premium


Premium


Premium


Premium


Premium

Premium


Premium


Premium


Premium


Premium


Premium

Premium

Premium


Premium


Premium


Premium


Premium


Premium


Premium


Premium


Explore More Free Stock Images