- Home >
- Stock Photos >
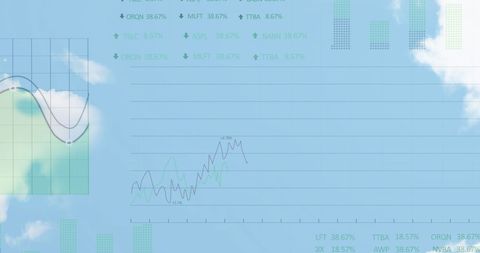
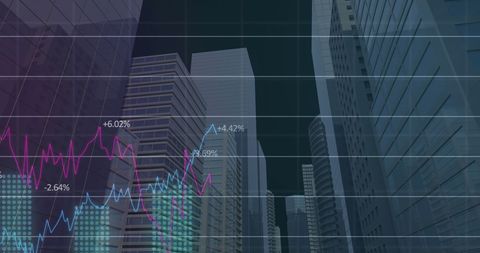
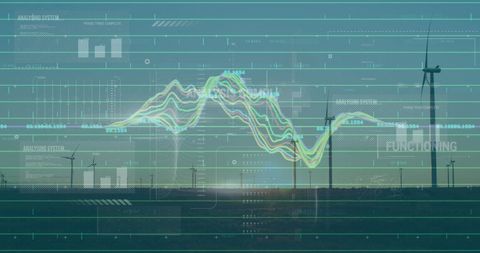
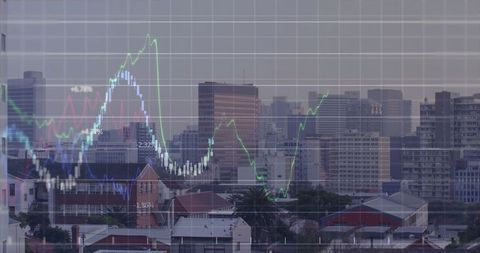
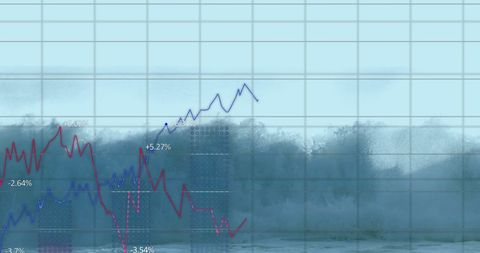
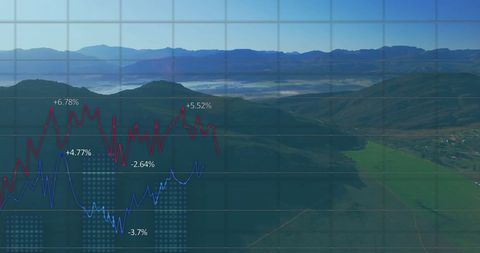
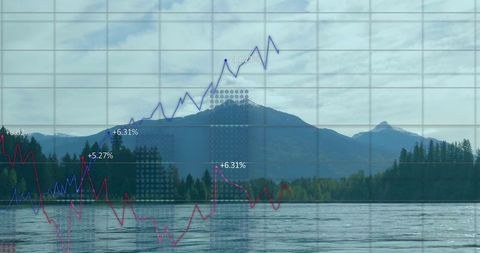
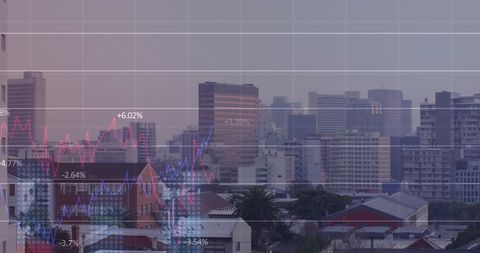
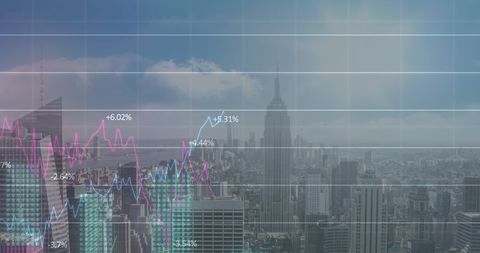
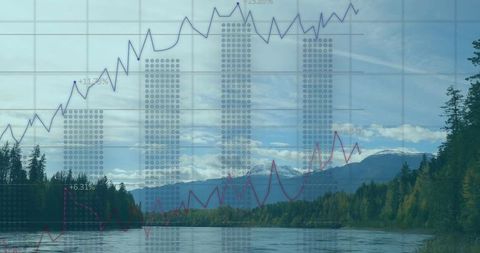
- Analyzing Financial Data Visualization Against Blue Sky
Analyzing Financial Data Visualization Against Blue Sky Image

Information embeds over a cloud and sky backdrop, highlighting the synergy between natural elements and technological themes in modern finance. Ideal for conveying abstract concepts of financial trends, digital economy, and business forecasts. Suitable for use in educational materials, business presentations, or as a metaphor for dynamic market changes spurred by modern technology.

downloads
Tags:
More
Credit Photo
If you would like to credit the Photo, here are some ways you can do so
Text Link
photo Link
<span class="text-link">
<span>
<a target="_blank" href=https://pikwizard.com/photo/analyzing-financial-data-visualization-against-blue-sky/8761360a783938b62489e1033fe170c8/>PikWizard</a>
</span>
</span>
<span class="image-link">
<span
style="margin: 0 0 20px 0; display: inline-block; vertical-align: middle; width: 100%;"
>
<a
target="_blank"
href="https://pikwizard.com/photo/analyzing-financial-data-visualization-against-blue-sky/8761360a783938b62489e1033fe170c8/"
style="text-decoration: none; font-size: 10px; margin: 0;"
>
<img src="https://pikwizard.com/pw/medium/8761360a783938b62489e1033fe170c8.jpg" style="margin: 0; width: 100%;" alt="" />
<p style="font-size: 12px; margin: 0;">PikWizard</p>
</a>
</span>
</span>
Free (free of charge)
Free for personal and commercial use.
Author: Creative Art