- Home >
- Stock Photos >
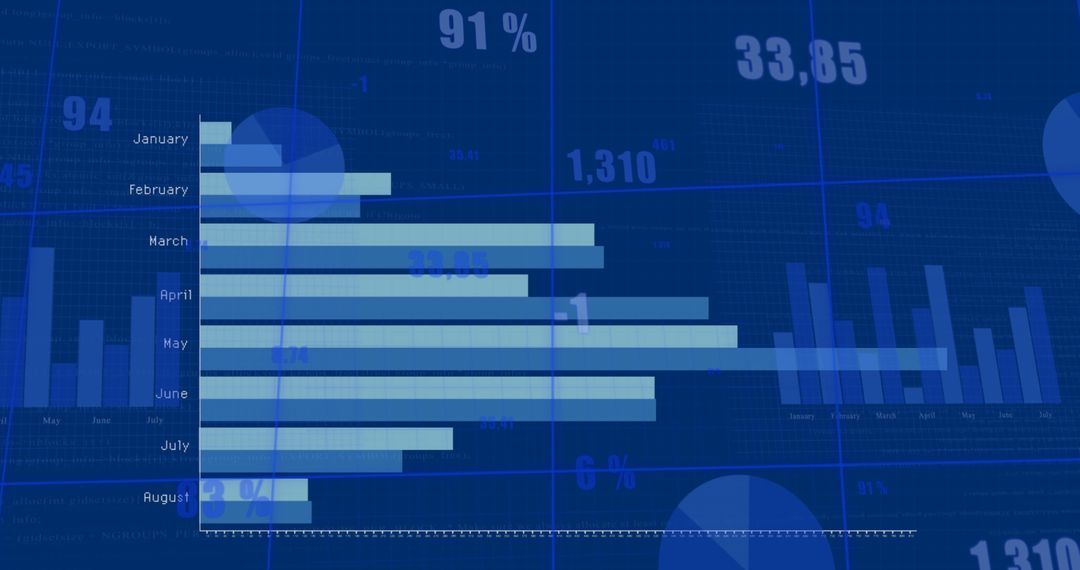
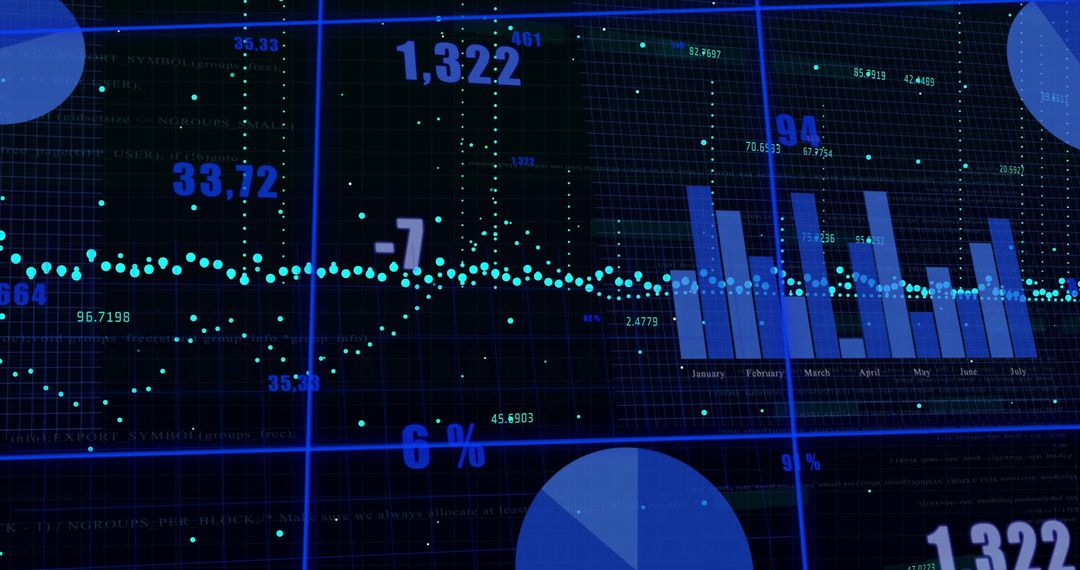
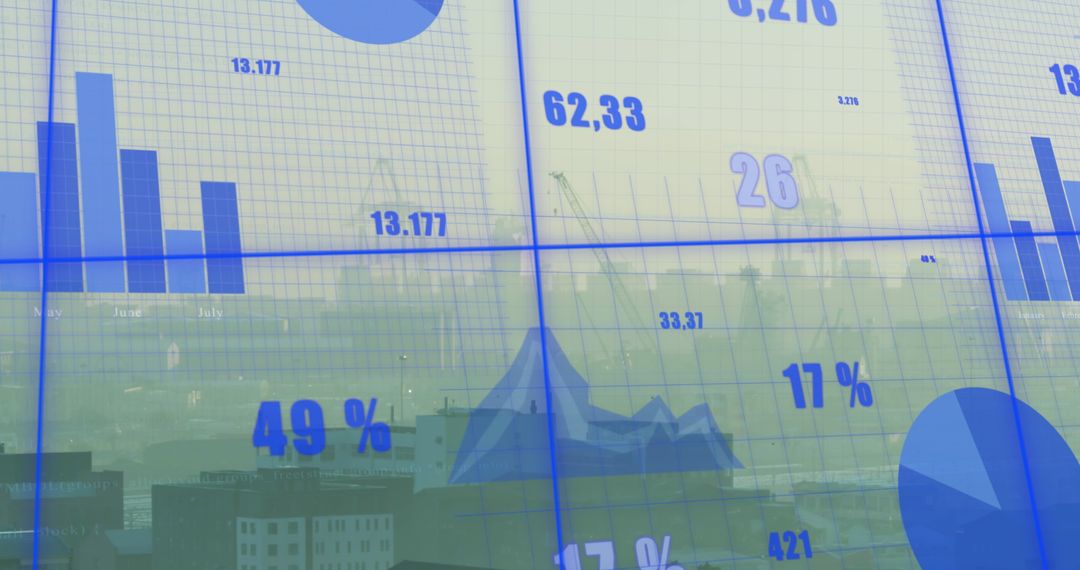
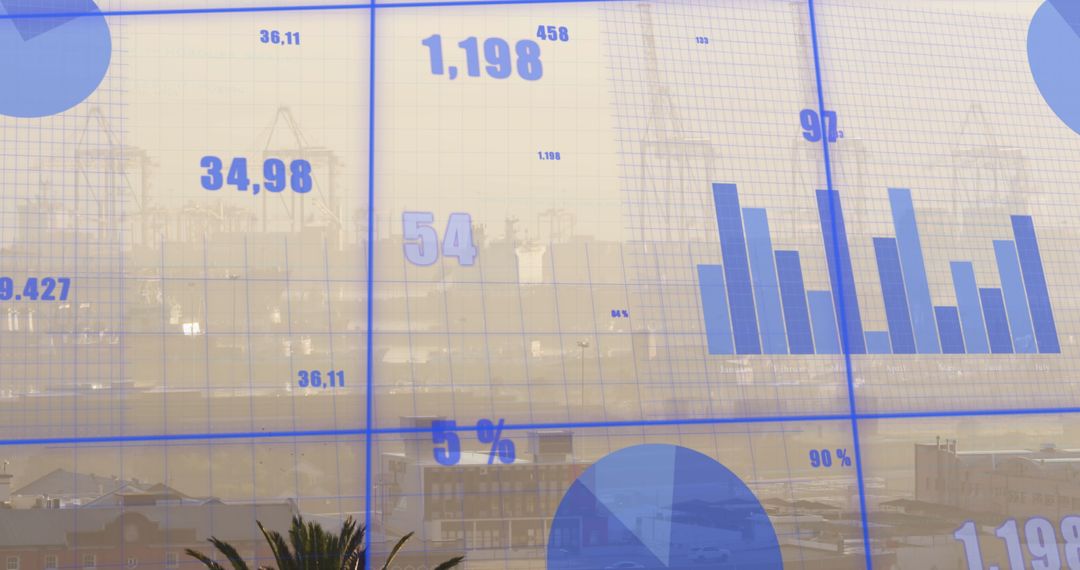
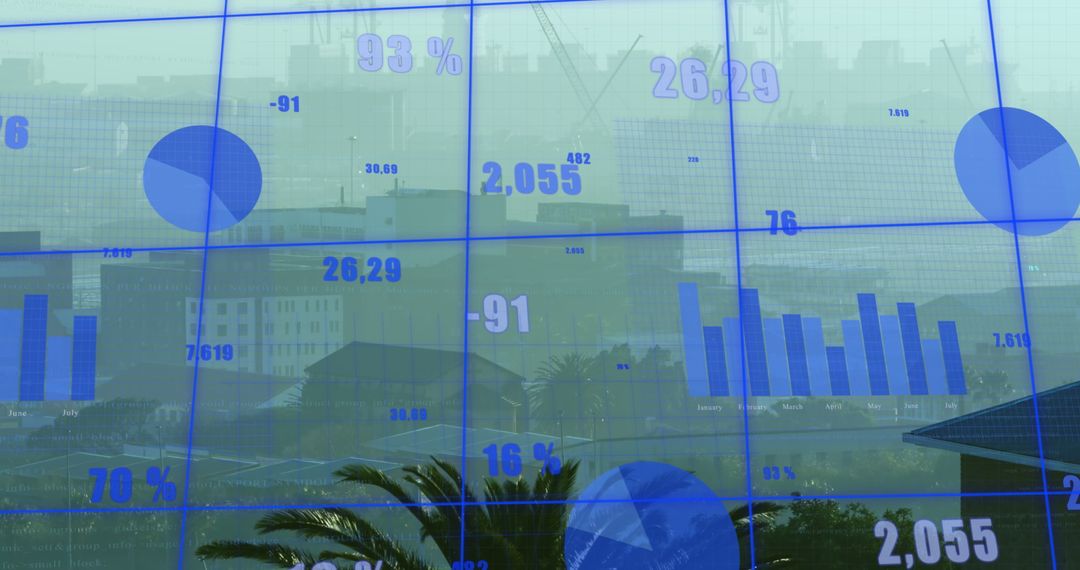
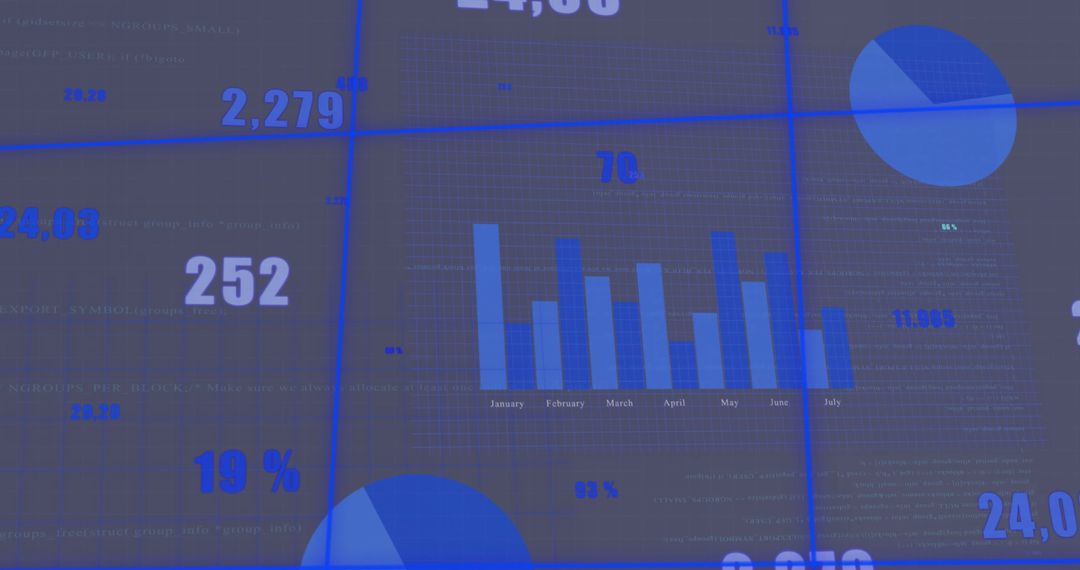
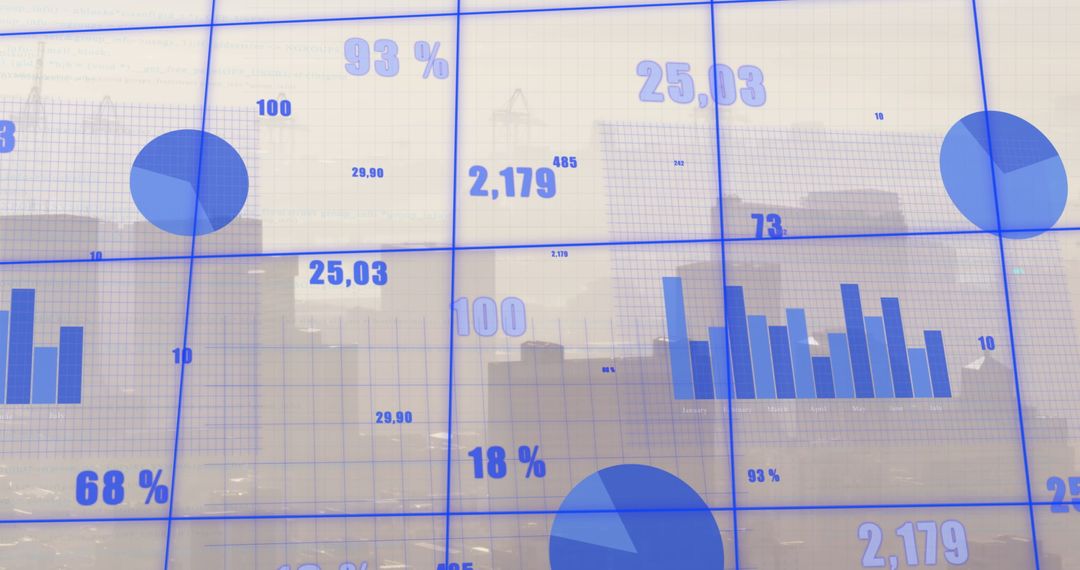
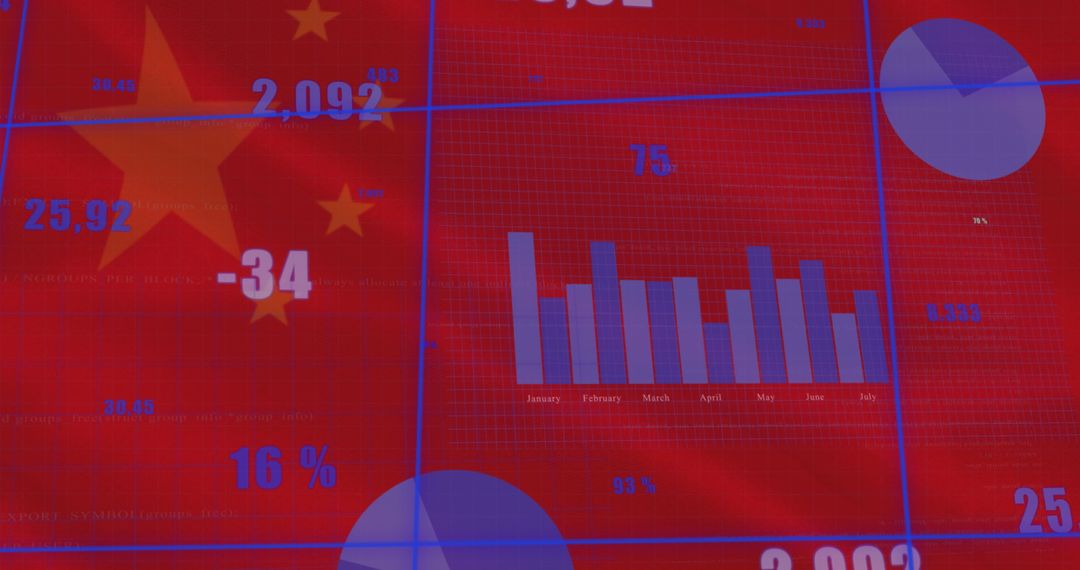
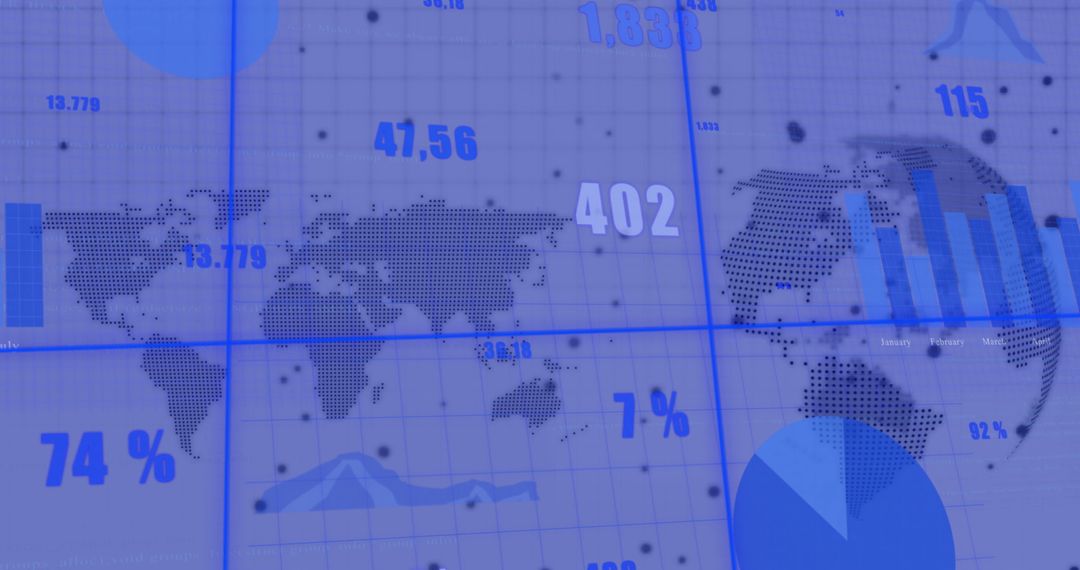
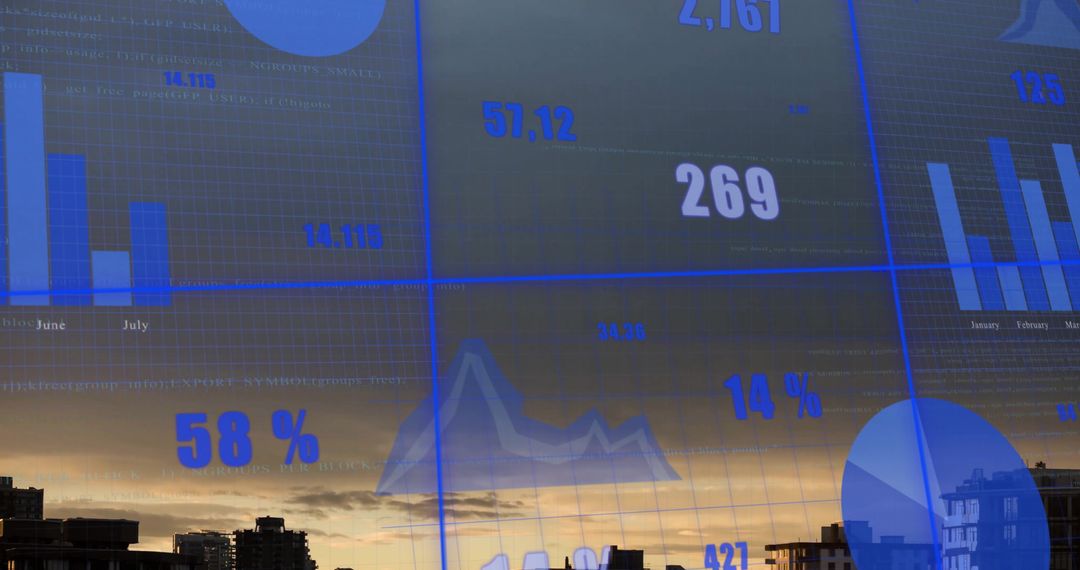
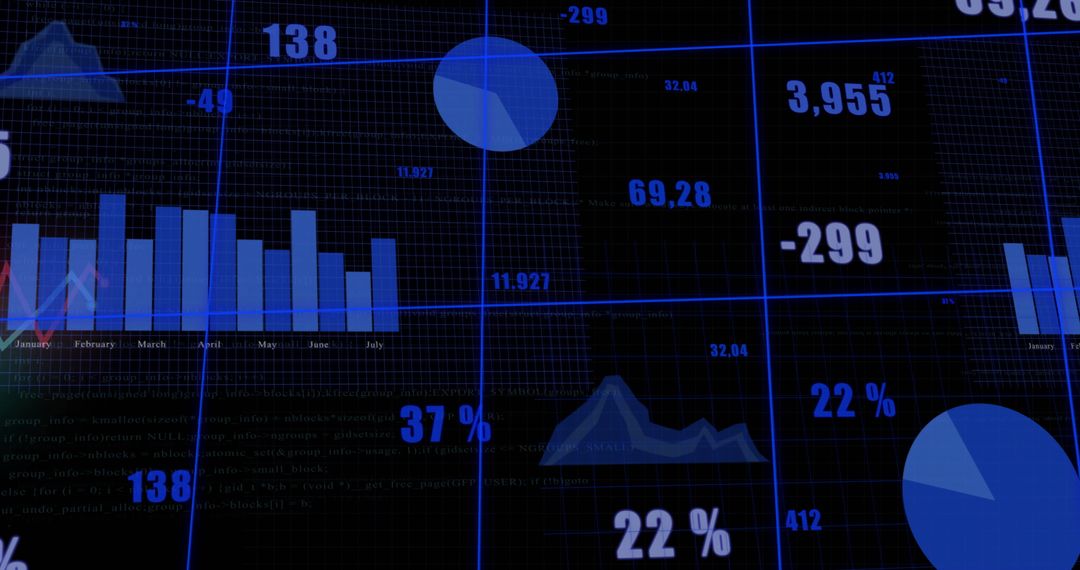
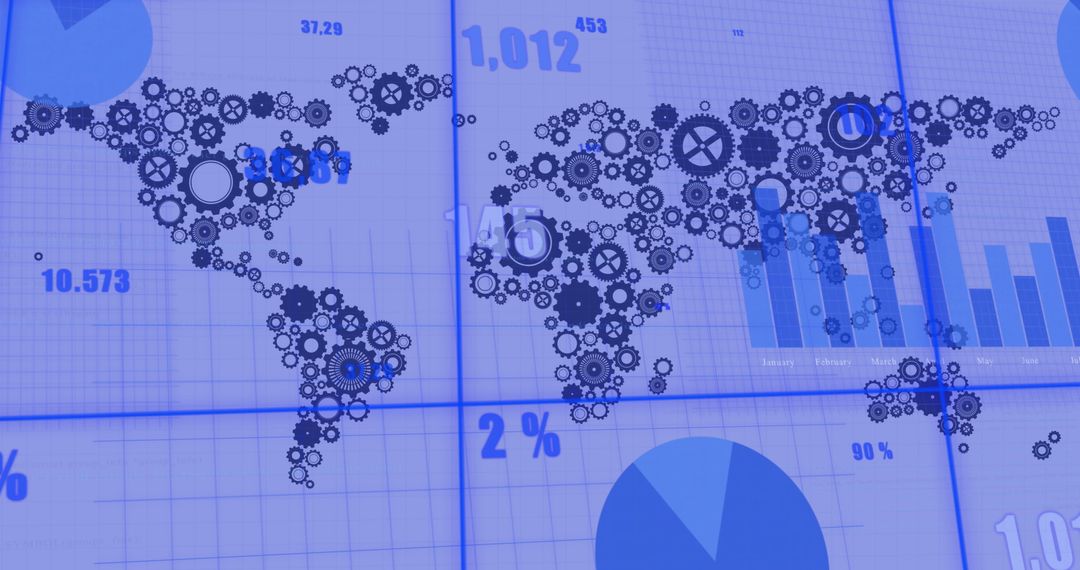
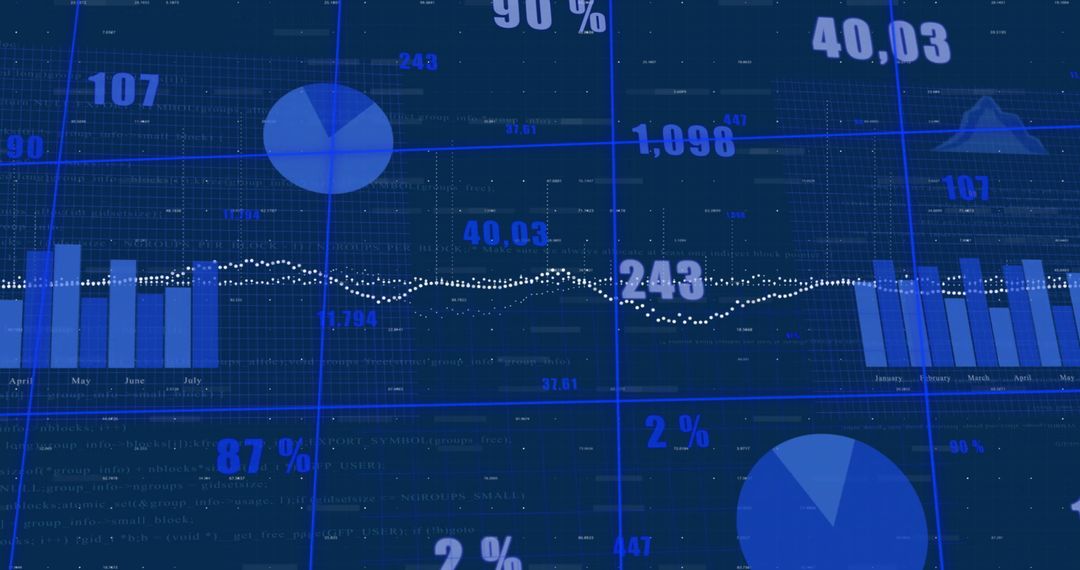
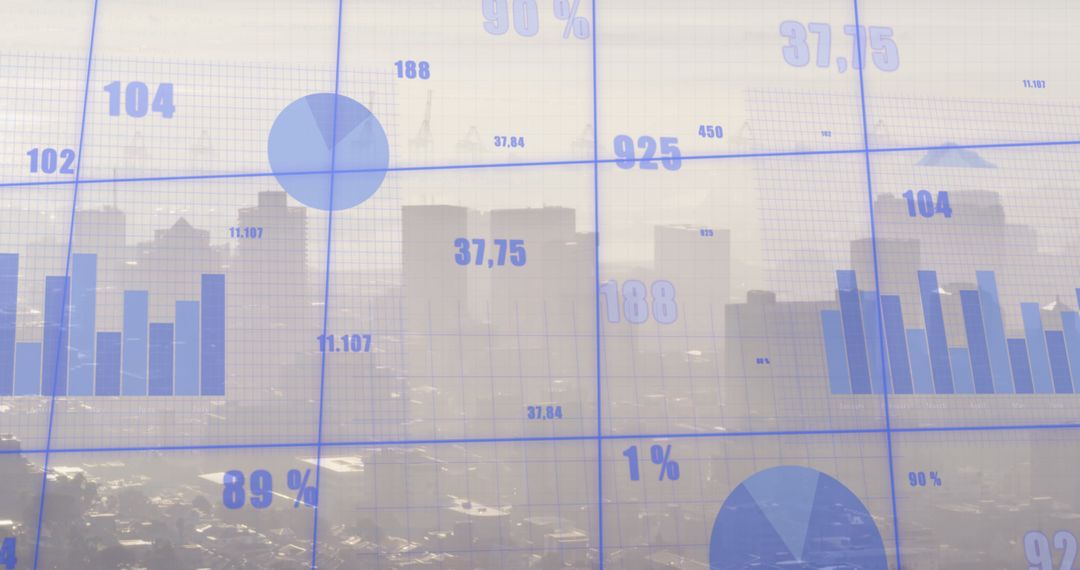
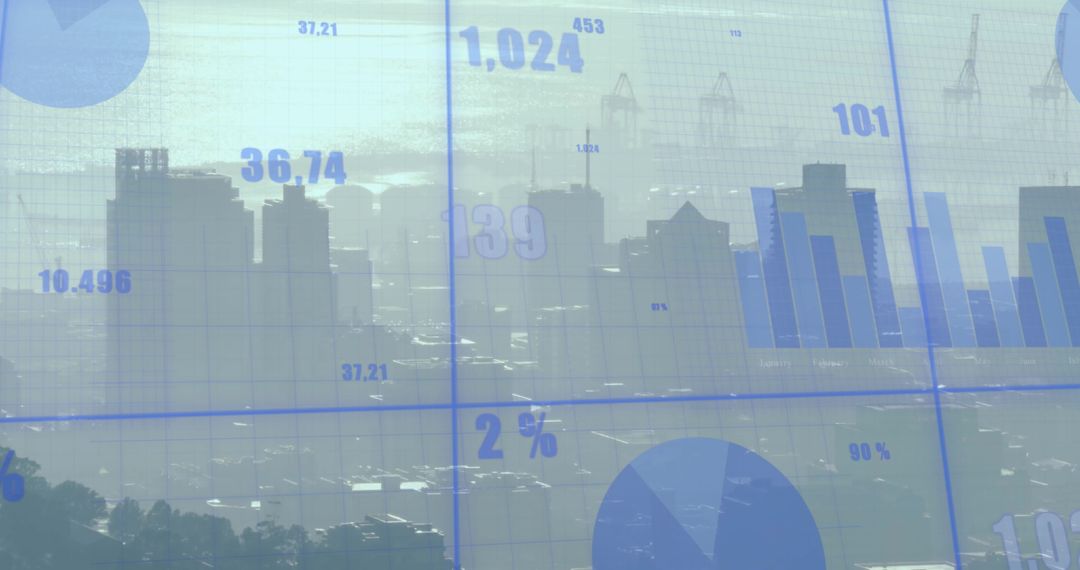
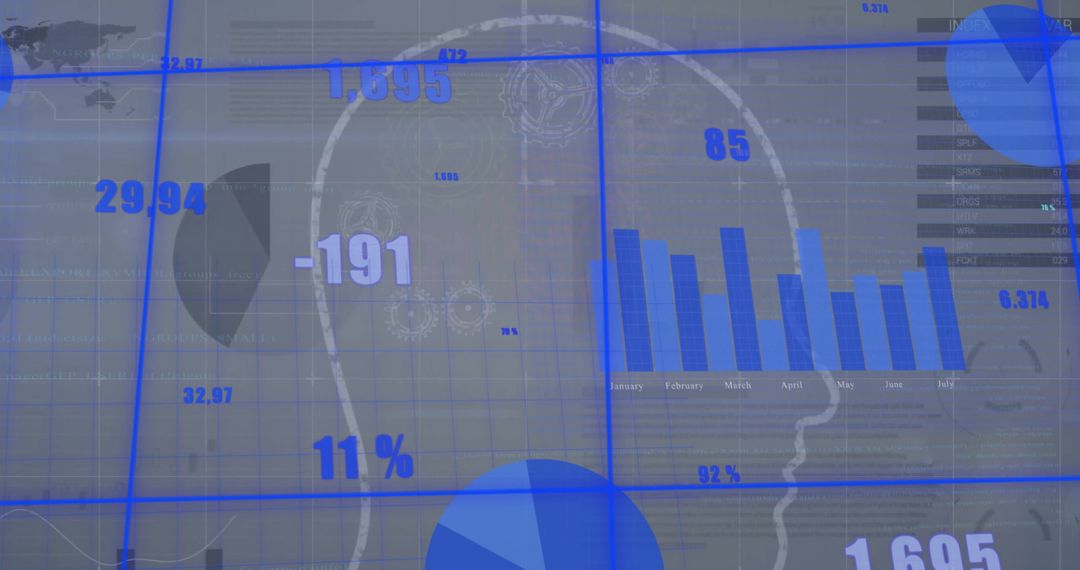
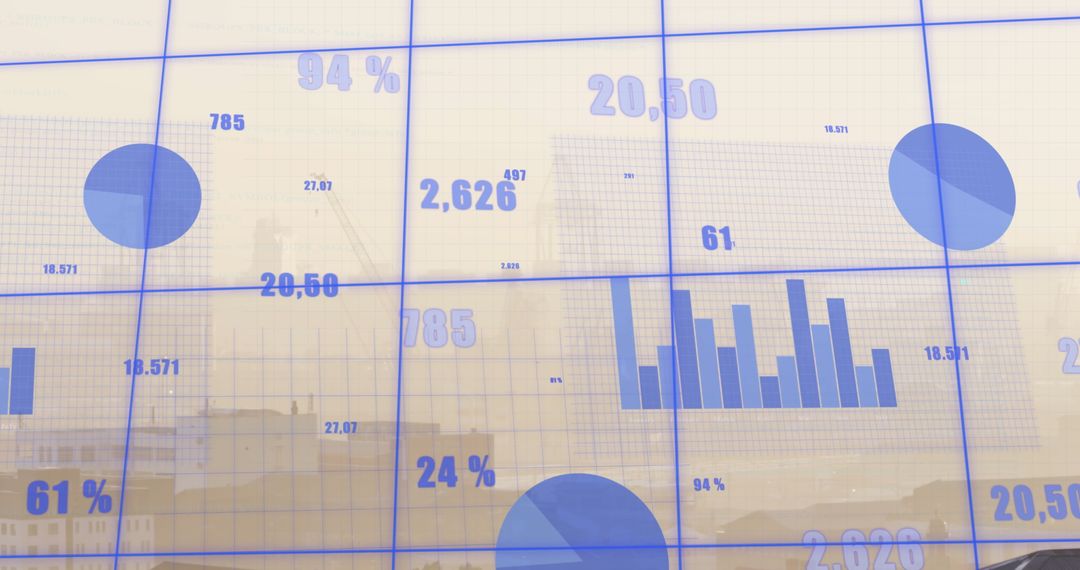
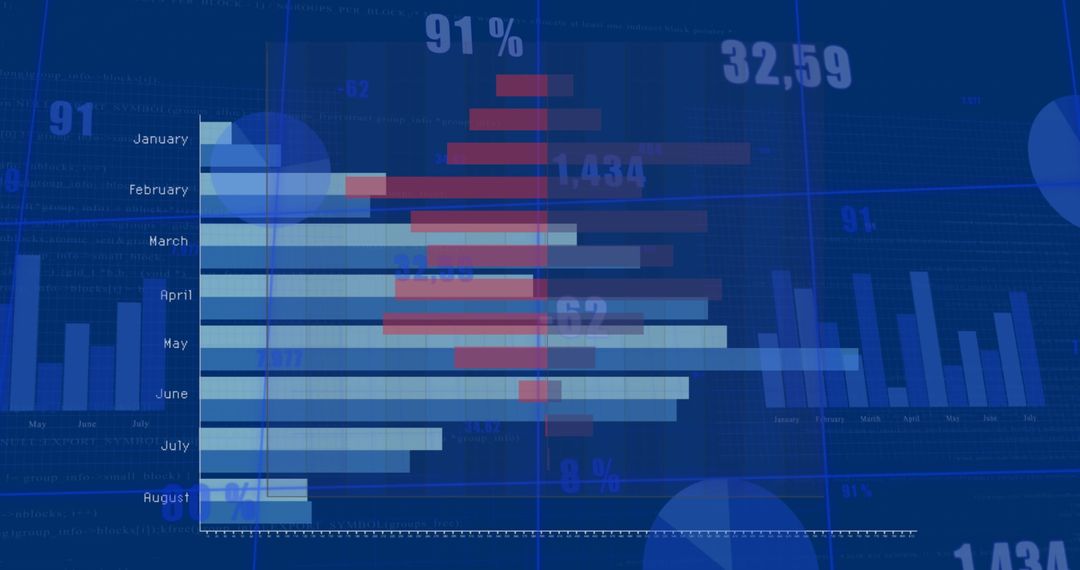
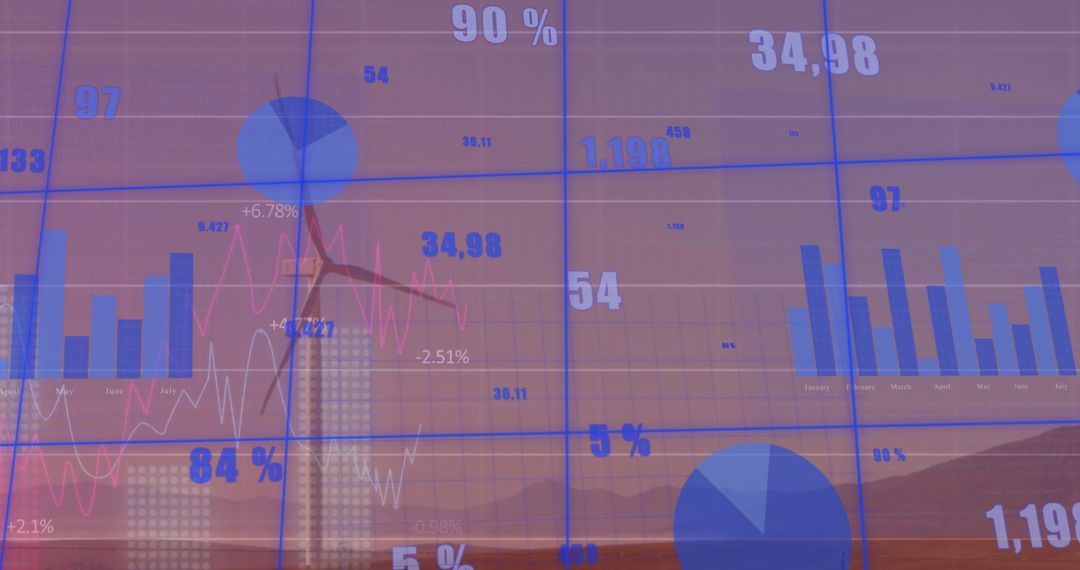
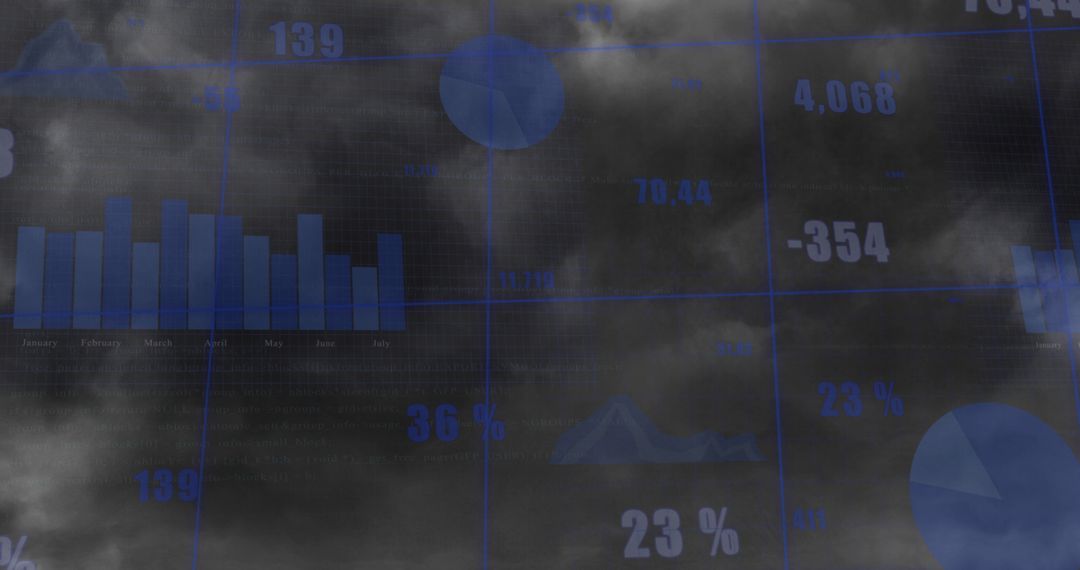
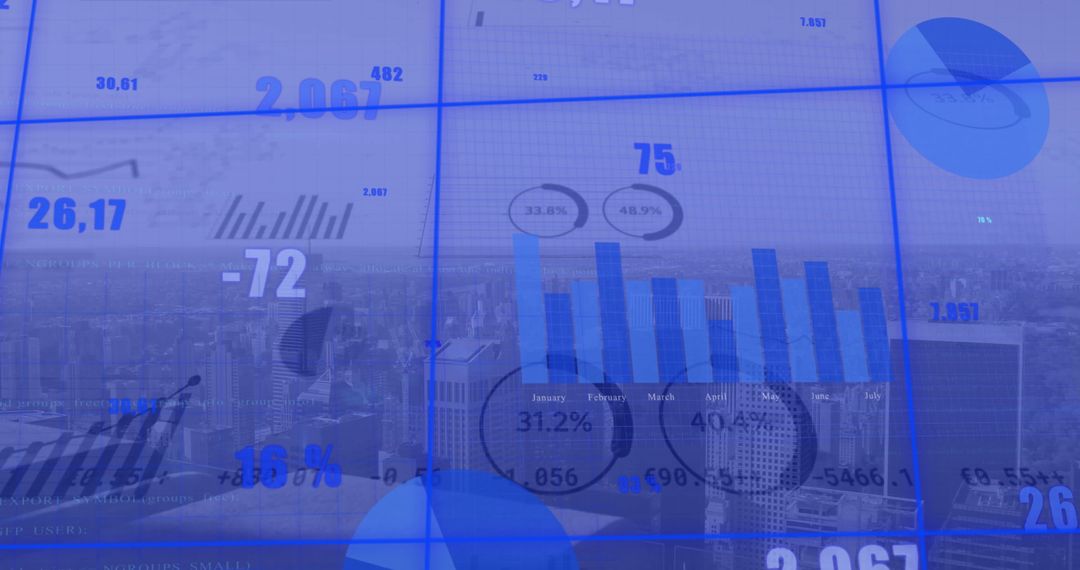
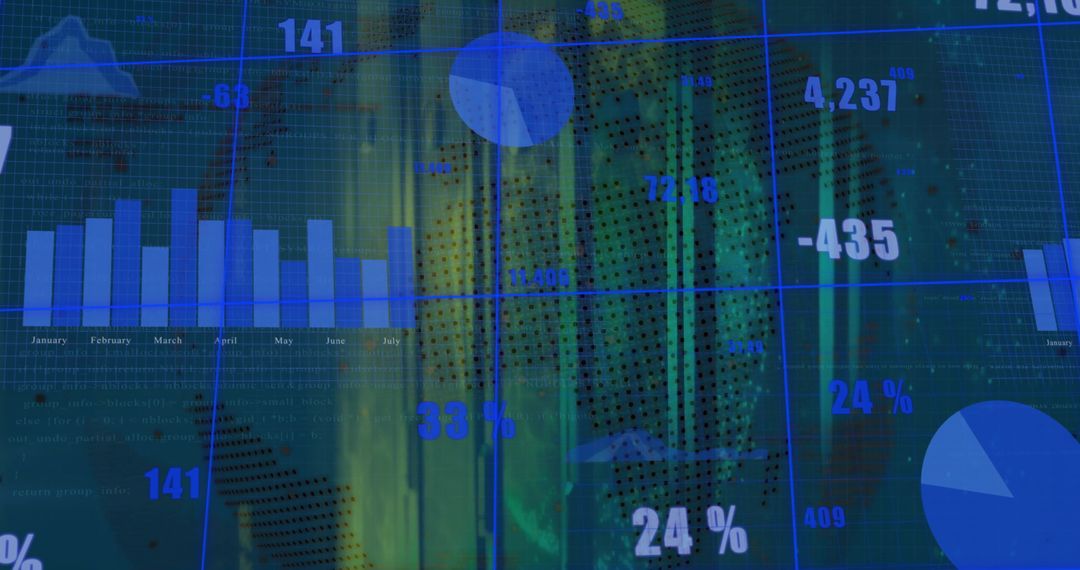
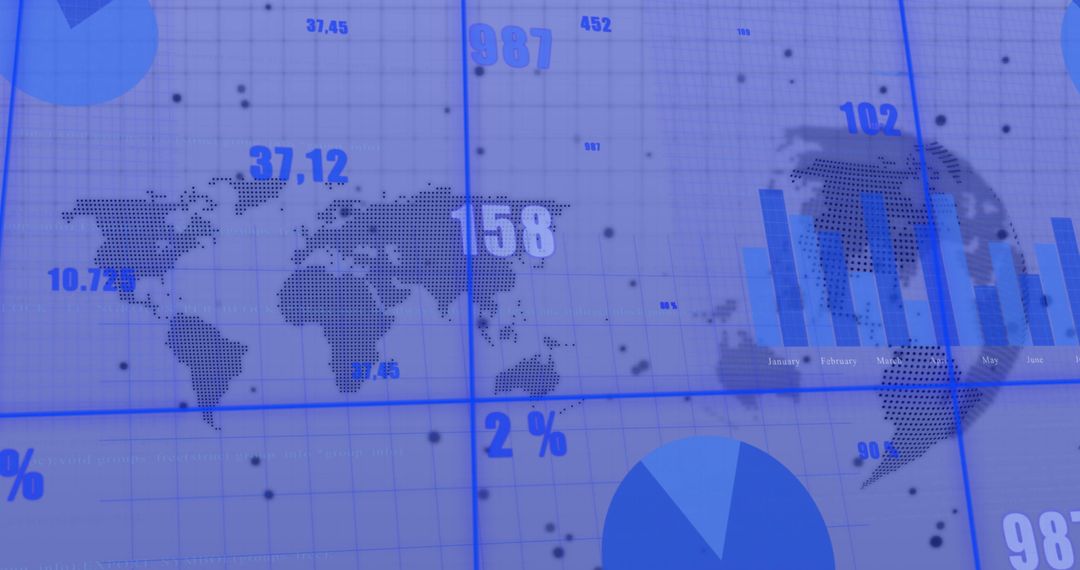
- Analyzing Financial Data with Charts and Graphs in Blue Environment
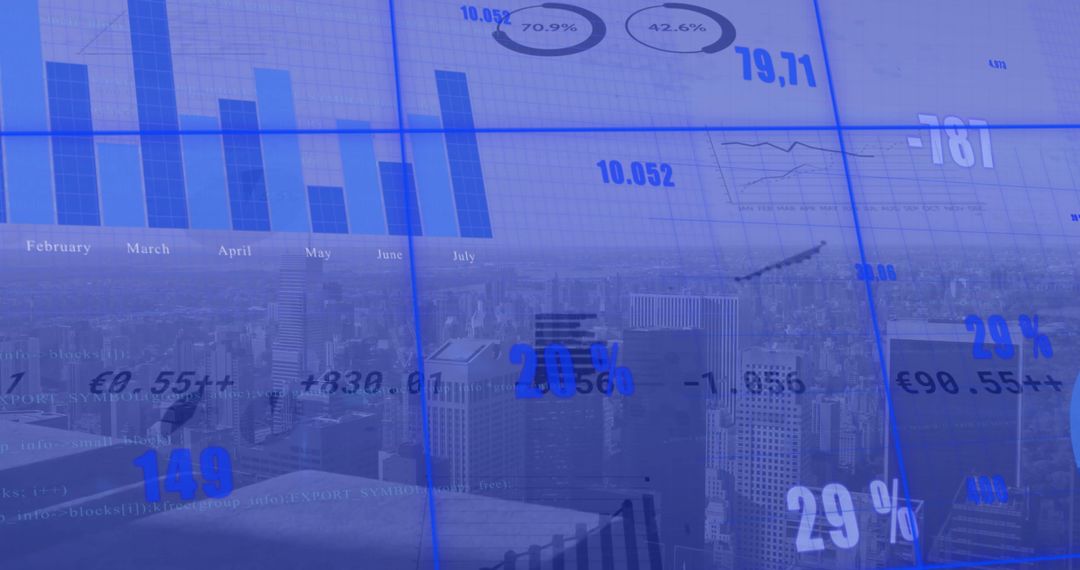
Analyzing Financial Data with Charts and Graphs in Blue Environment Image
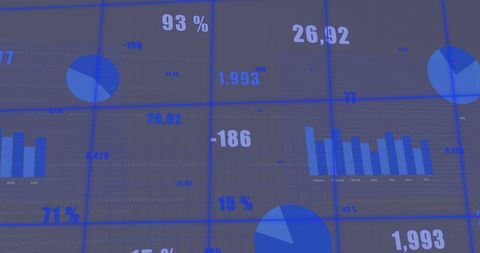
Visual representation of analyzing financial data through charts and graphs with a blue-themed interface. Ideal for use in financial reports, presentations, educational materials on financing and data science, and showcases for business solutions in global markets.
Powered by  - Get 15% off with code: PIKWIZARD15


2
downloads
downloads
Tags:
More
Credit Photo
If you would like to credit the Photo, here are some ways you can do so
Text Link
photo Link
<span class="text-link">
<span>
<a target="_blank" href=https://pikwizard.com/photo/analyzing-financial-data-with-charts-and-graphs-in-blue-environment/2840076a78cd0e4ccbca307ca69089de/>PikWizard</a>
</span>
</span>
<span class="image-link">
<span
style="margin: 0 0 20px 0; display: inline-block; vertical-align: middle; width: 100%;"
>
<a
target="_blank"
href="https://pikwizard.com/photo/analyzing-financial-data-with-charts-and-graphs-in-blue-environment/2840076a78cd0e4ccbca307ca69089de/"
style="text-decoration: none; font-size: 10px; margin: 0;"
>
<img src="https://pikwizard.com/pw/medium/2840076a78cd0e4ccbca307ca69089de.jpg" style="margin: 0; width: 100%;" alt="" />
<p style="font-size: 12px; margin: 0;">PikWizard</p>
</a>
</span>
</span>
Free (free of charge)
Free for personal and commercial use.
Author: People Creations
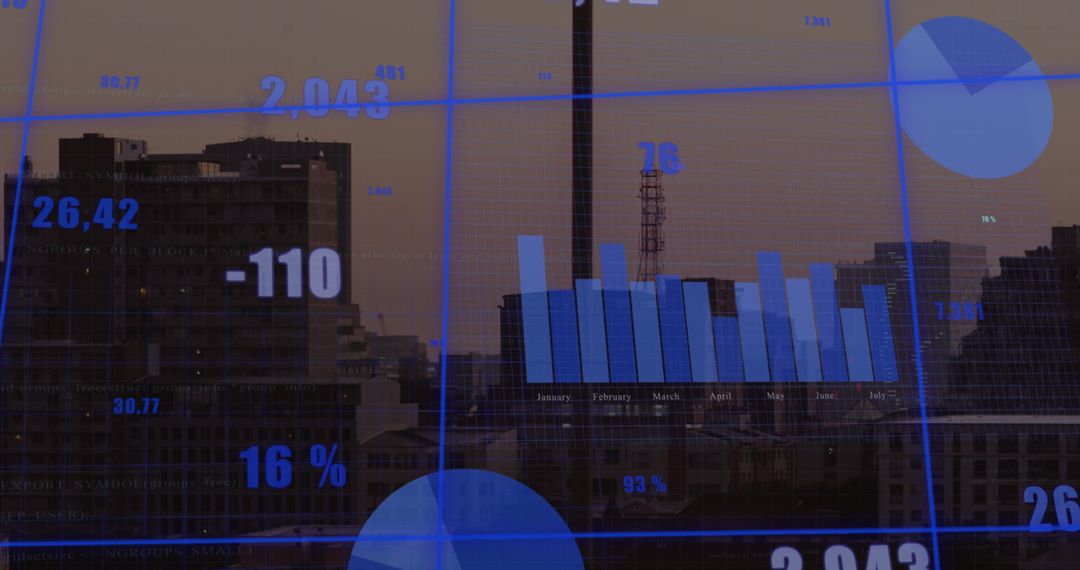
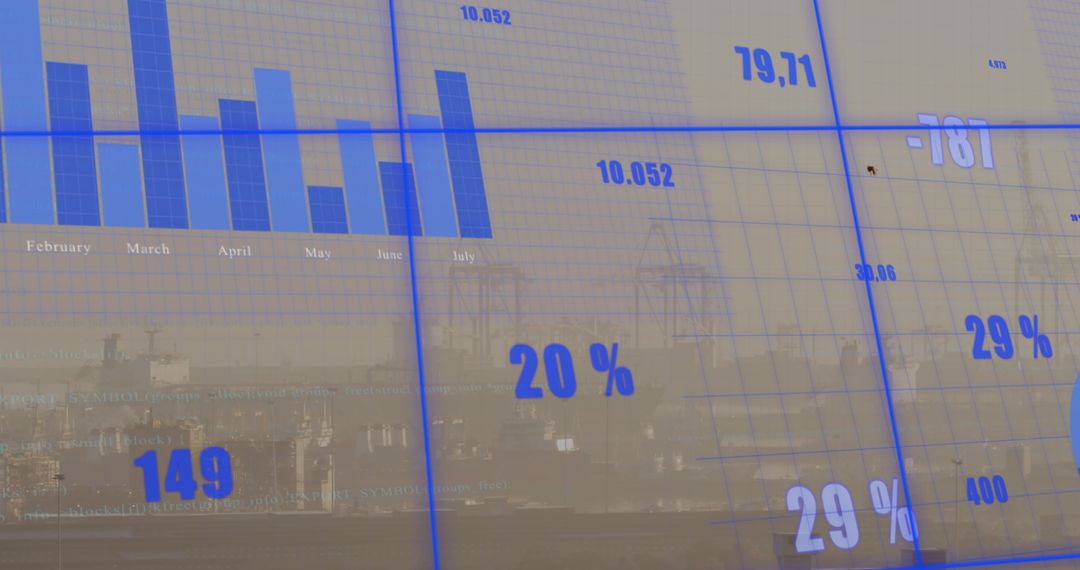
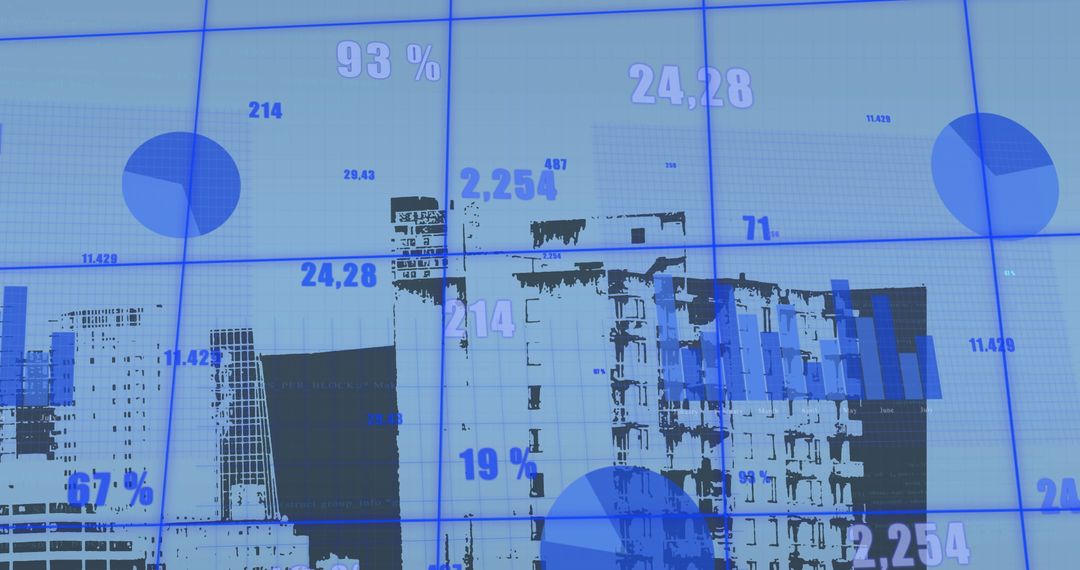
Similar Free Stock Images

Premium


Premium


Premium


Premium


Premium


Premium


Premium


Premium


Premium


Premium


Premium


Premium


Premium


Premium


Premium


Premium


Premium


Premium


Premium


Premium


Premium


Premium


Premium


Premium