
- Home >
- Stock Photos >
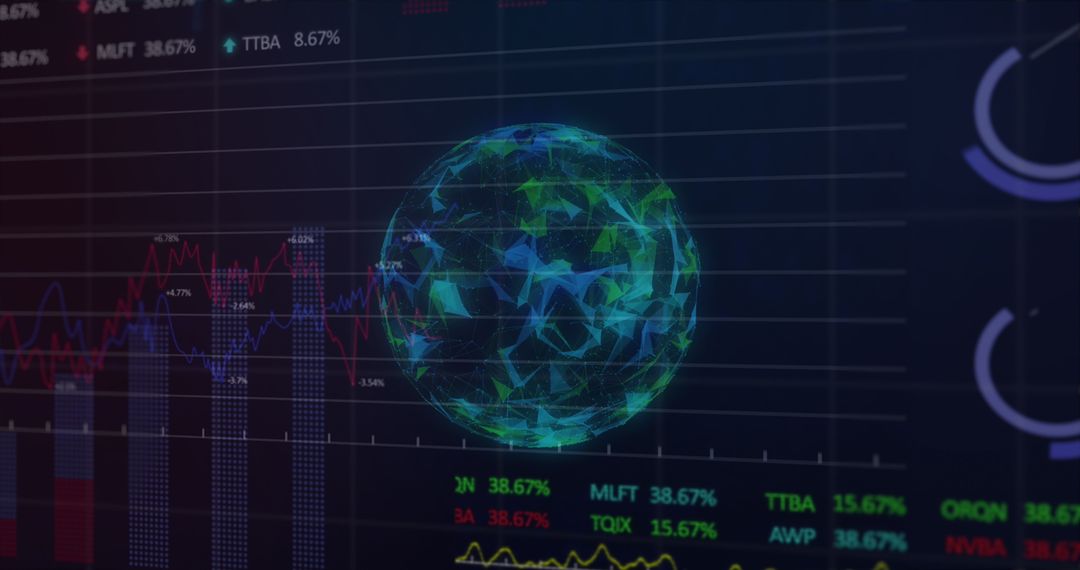
- Analyzing Financial Data with Global Trends and Charts
Analyzing Financial Data with Global Trends and Charts Image

Illustrates financial data analysis overlayed with global trends and technical charts. Suitable for topics on global business, financial markets, investment strategies, and technological finance innovations. Useful for websites, presentations, and articles focusing on data-driven decision-making and economic forecasts.
Powered by  - Get 15% off with code: PIKWIZARD15


2
downloads
downloads
Tags:
More
Credit Photo
If you would like to credit the Photo, here are some ways you can do so
Text Link
photo Link
<span class="text-link">
<span>
<a target="_blank" href=https://pikwizard.com/photo/analyzing-financial-data-with-global-trends-and-charts/74e986d1618dc188ec4c97c6eedb2989/>PikWizard</a>
</span>
</span>
<span class="image-link">
<span
style="margin: 0 0 20px 0; display: inline-block; vertical-align: middle; width: 100%;"
>
<a
target="_blank"
href="https://pikwizard.com/photo/analyzing-financial-data-with-global-trends-and-charts/74e986d1618dc188ec4c97c6eedb2989/"
style="text-decoration: none; font-size: 10px; margin: 0;"
>
<img src="https://pikwizard.com/pw/medium/74e986d1618dc188ec4c97c6eedb2989.jpg" style="margin: 0; width: 100%;" alt="" />
<p style="font-size: 12px; margin: 0;">PikWizard</p>
</a>
</span>
</span>
Free (free of charge)
Free for personal and commercial use.
Author: Awesome Content
Similar Free Stock Images

Premium


Premium


Premium


Premium


Premium


Premium


Premium


Premium


Premium


Premium


Premium


Premium


Premium


Premium


Premium


Premium


Premium


Premium


Premium


Premium


Premium


Premium


Premium


Premium

