
- Home >
- Stock Photos >
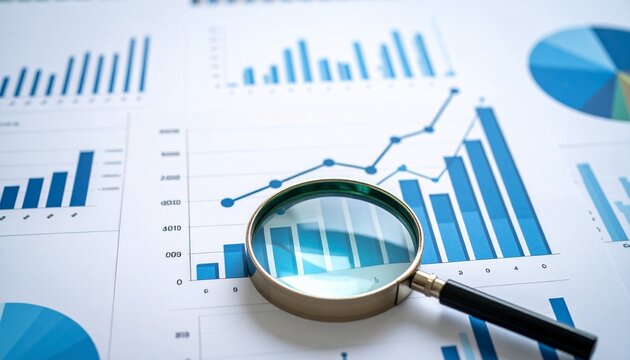
- Analyzing Financial Data with Graphs and Charts
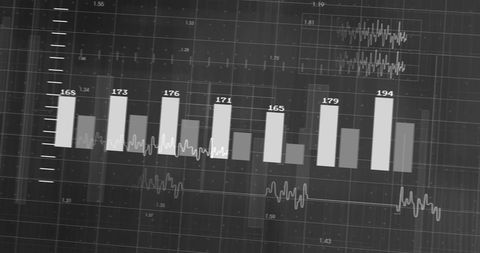
Analyzing Financial Data with Graphs and Charts Image

Detailed visualization showing financial data with graphs and charts against a black backdrop. Ideal for use in presentations on economic analysis, preparing reports on market trends or illustrating financial lectures. Useful for those in the field of finance, business analysis, and digital data visualization.
Powered by 


downloads
Tags:
More
Credit Photo
If you would like to credit the Photo, here are some ways you can do so
Text Link
photo Link
<span class="text-link">
<span>
<a target="_blank" href=https://pikwizard.com/photo/analyzing-financial-data-with-graphs-and-charts/c00673b54dc3617ef778e2c8bddb901c/>PikWizard</a>
</span>
</span>
<span class="image-link">
<span
style="margin: 0 0 20px 0; display: inline-block; vertical-align: middle; width: 100%;"
>
<a
target="_blank"
href="https://pikwizard.com/photo/analyzing-financial-data-with-graphs-and-charts/c00673b54dc3617ef778e2c8bddb901c/"
style="text-decoration: none; font-size: 10px; margin: 0;"
>
<img src="https://pikwizard.com/pw/medium/c00673b54dc3617ef778e2c8bddb901c.jpg" style="margin: 0; width: 100%;" alt="" />
<p style="font-size: 12px; margin: 0;">PikWizard</p>
</a>
</span>
</span>
Free (free of charge)
Free for personal and commercial use.
Author: People Creations
Similar Free Stock Images

Premium


Premium


Premium


Premium


Premium


Premium


Premium


Premium


Premium


Premium


Premium


Premium

Premium

Premium


Premium


Premium

Premium


Premium


Premium

Premium


Premium


Premium


Premium


Premium


Premium


Explore More Free Stock Images