
- Home >
- Stock Photos >
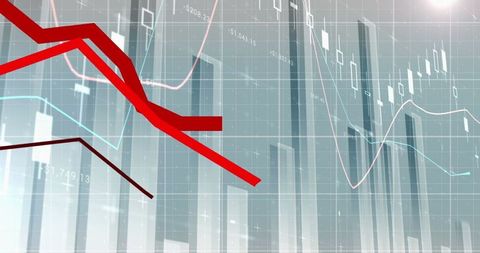
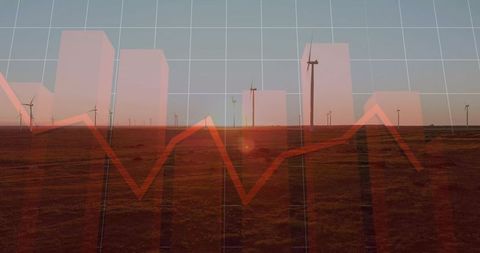
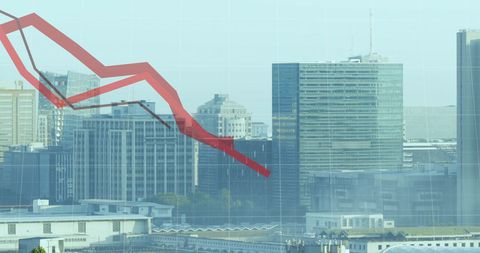
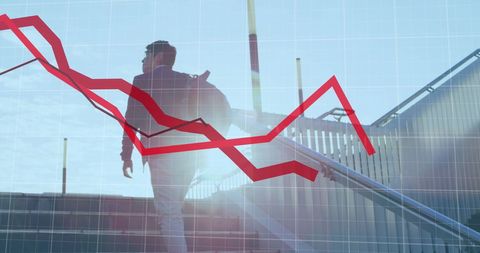
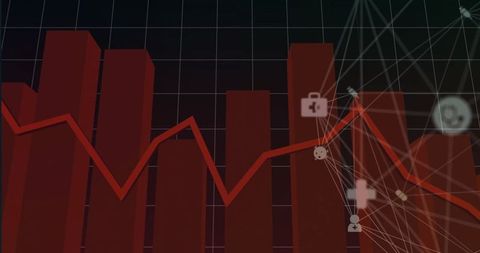
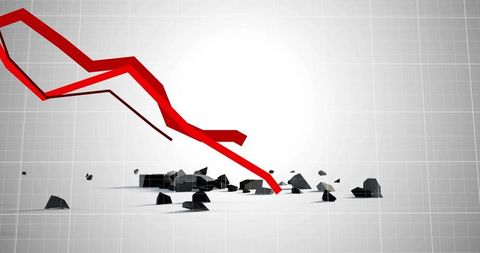
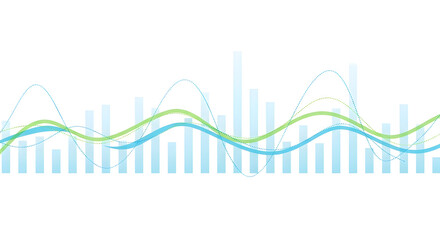
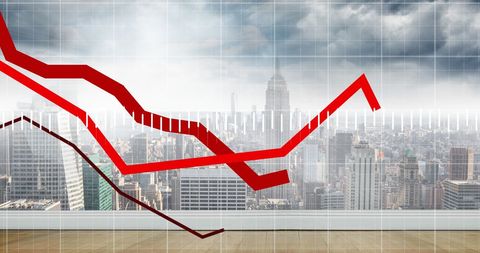
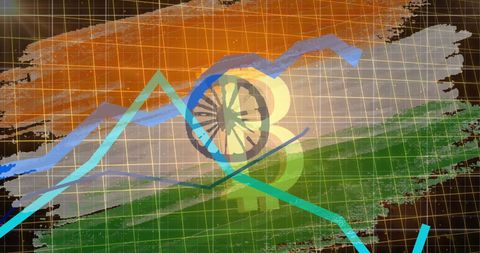
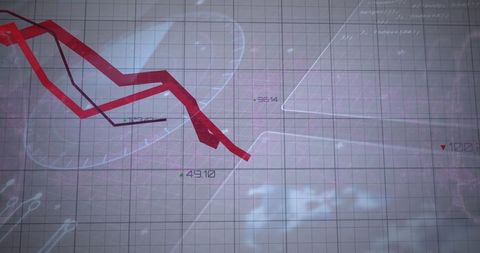
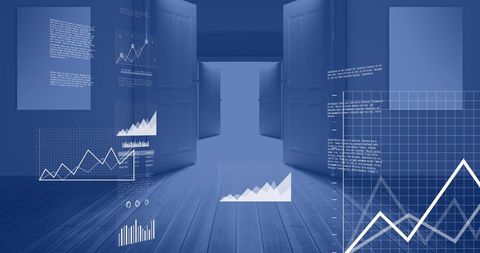
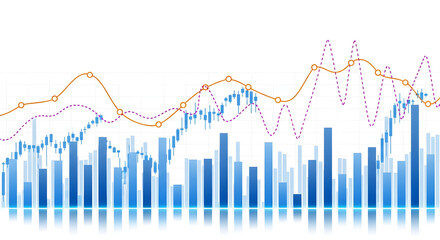
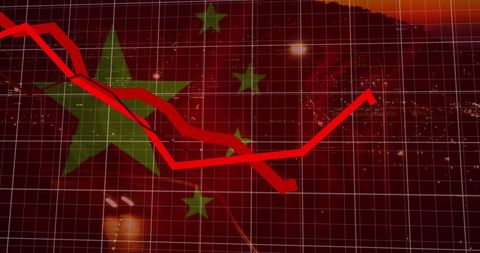
- Analyzing Financial Data with Graphs and Red Trend Lines
Analyzing Financial Data with Graphs and Red Trend Lines Image
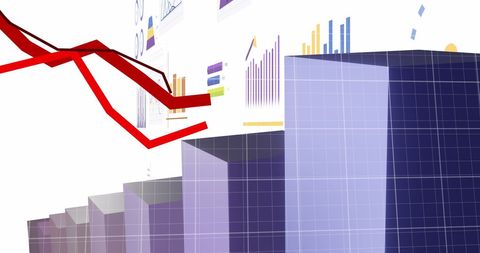
Abstract composition featuring red trend lines combined with bar graphs indicating data analysis trends. Useful for illustrating economic reports, financial technology, business performance reviews, and corporate presentations related to analytics dynamics.
Powered by 


downloads
Tags:
More
Credit Photo
If you would like to credit the Photo, here are some ways you can do so
Text Link
photo Link
<span class="text-link">
<span>
<a target="_blank" href=https://pikwizard.com/photo/analyzing-financial-data-with-graphs-and-red-trend-lines/c84e9f2e8564cfddaaee9698f3a45117/>PikWizard</a>
</span>
</span>
<span class="image-link">
<span
style="margin: 0 0 20px 0; display: inline-block; vertical-align: middle; width: 100%;"
>
<a
target="_blank"
href="https://pikwizard.com/photo/analyzing-financial-data-with-graphs-and-red-trend-lines/c84e9f2e8564cfddaaee9698f3a45117/"
style="text-decoration: none; font-size: 10px; margin: 0;"
>
<img src="https://pikwizard.com/pw/medium/c84e9f2e8564cfddaaee9698f3a45117.jpg" style="margin: 0; width: 100%;" alt="" />
<p style="font-size: 12px; margin: 0;">PikWizard</p>
</a>
</span>
</span>
Free (free of charge)
Free for personal and commercial use.
Author: Awesome Content
Similar Free Stock Images

Premium


Premium

Premium

Premium


Premium


Premium


Premium


Premium

Premium


Premium


Premium


Premium


Premium


Premium

Premium
Premium


Premium


Premium


Premium


Premium


Premium


Premium


Premium


Premium


Premium

Explore More Free Stock Images