- Home >
- Stock Photos >
- Analyzing Financial Data with Overlaid Graphs and Technology
Analyzing Financial Data with Overlaid Graphs and Technology Image

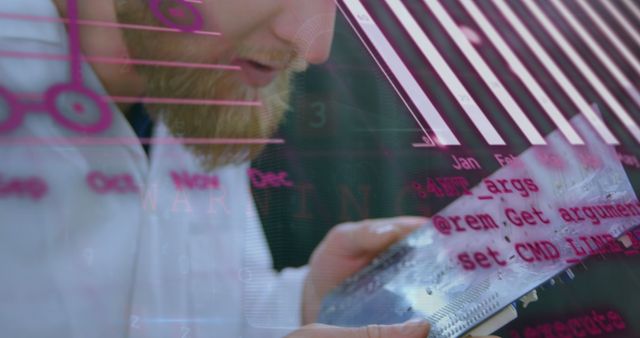
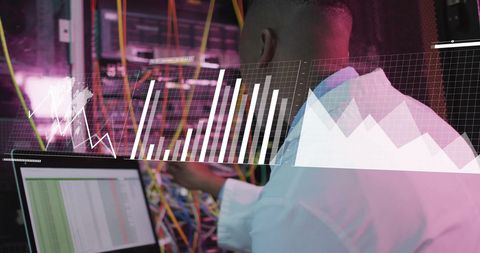
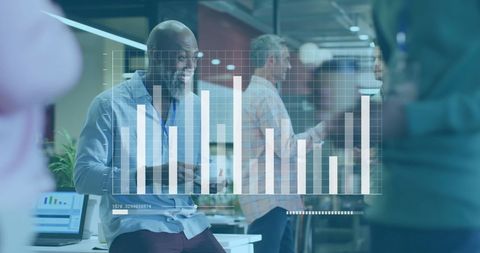
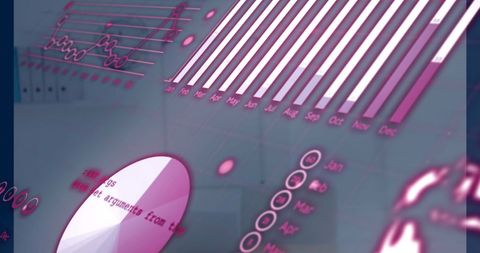
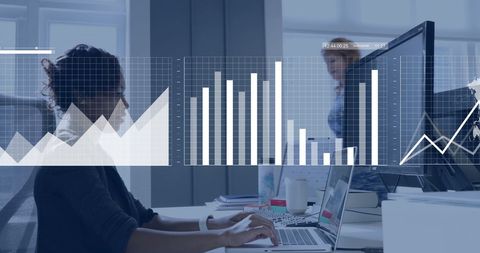
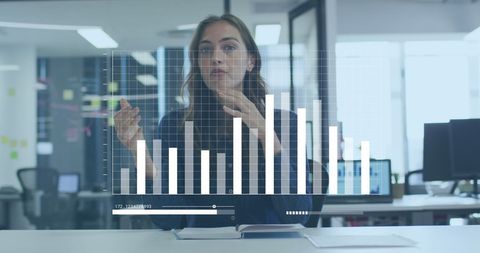
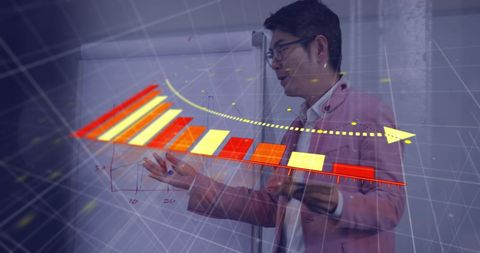
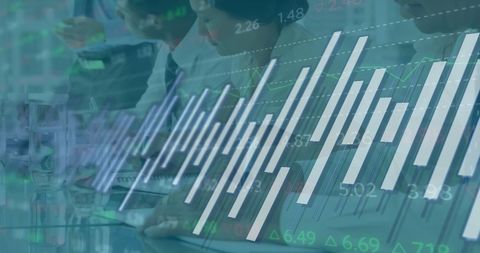
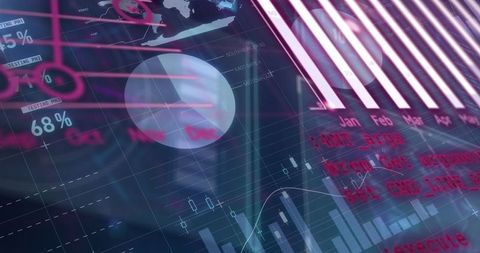
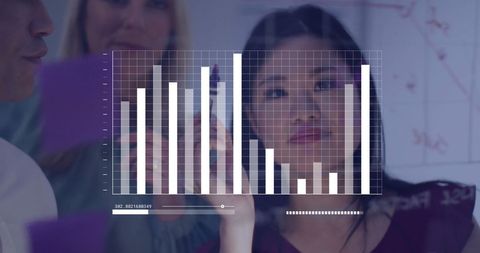
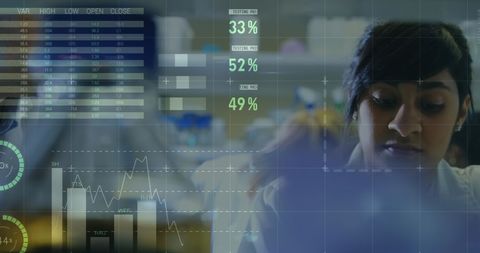
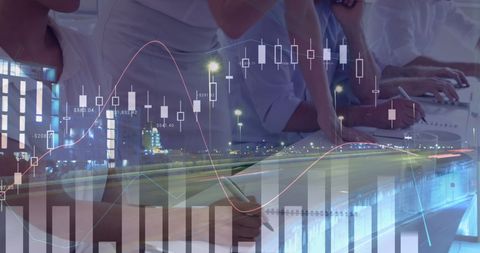
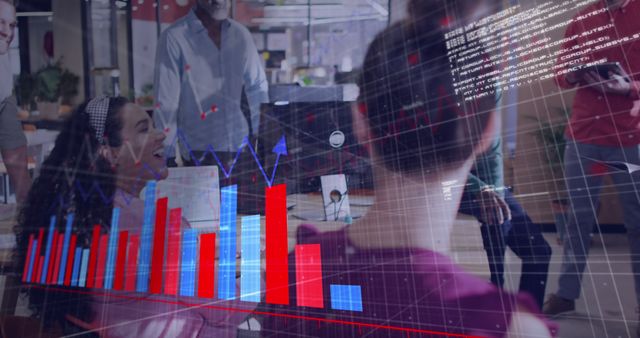
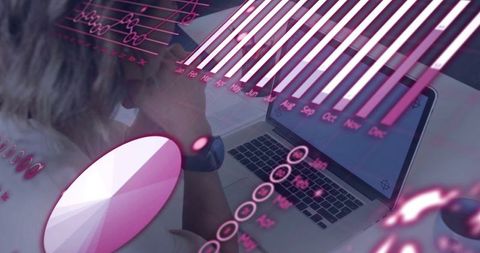
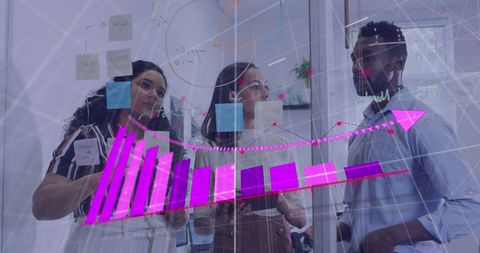
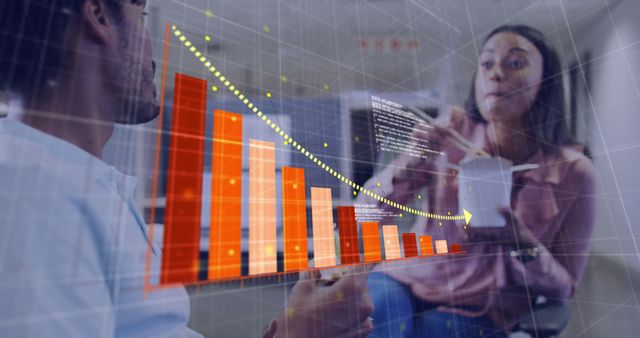
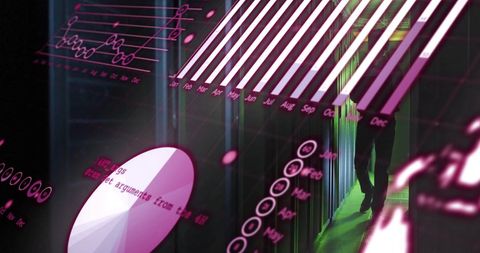
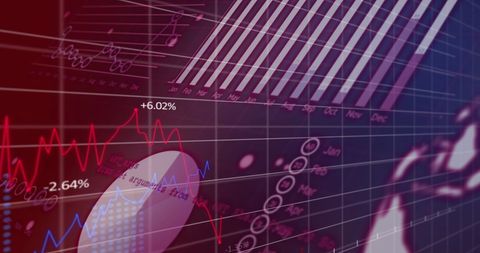
Image features business professionals surrounded by translucent digital graphs, illustrating financial data analysis and technology integration. This can be used to represent global finance, modern business operations, or corporate technology strategies. Suitable for use in articles or sites focusing on business analytics, data-driven decision making, and technological advancements in finance.

downloads
Tags:
More
Credit Photo
If you would like to credit the Photo, here are some ways you can do so
Text Link
photo Link
<span class="text-link">
<span>
<a target="_blank" href=https://pikwizard.com/photo/analyzing-financial-data-with-overlaid-graphs-and-technology/df350f80c093380b67f0e430bfa3ba64/>PikWizard</a>
</span>
</span>
<span class="image-link">
<span
style="margin: 0 0 20px 0; display: inline-block; vertical-align: middle; width: 100%;"
>
<a
target="_blank"
href="https://pikwizard.com/photo/analyzing-financial-data-with-overlaid-graphs-and-technology/df350f80c093380b67f0e430bfa3ba64/"
style="text-decoration: none; font-size: 10px; margin: 0;"
>
<img src="https://pikwizard.com/pw/medium/df350f80c093380b67f0e430bfa3ba64.jpg" style="margin: 0; width: 100%;" alt="" />
<p style="font-size: 12px; margin: 0;">PikWizard</p>
</a>
</span>
</span>
Free (free of charge)
Free for personal and commercial use.
Author: Creative Art