
- Home >
- Stock Photos >
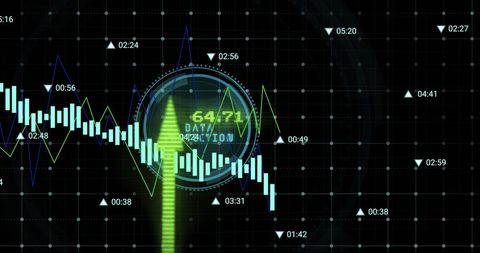
- Analyzing Financial Graphs with Real-Time Data Trends
Analyzing Financial Graphs with Real-Time Data Trends Image

Highlights dynamic chart illustrating financial data analysis using modern technology tools. Ideal for representing investment trends, stock market insights, or business economic reports in tech-savvy presentations, blogs, or articles on finance and global markets.
Powered by 


downloads
Tags:
More
Credit Photo
If you would like to credit the Photo, here are some ways you can do so
Text Link
photo Link
<span class="text-link">
<span>
<a target="_blank" href=https://pikwizard.com/photo/analyzing-financial-graphs-with-real-time-data-trends/ee93da11a72df987e76f6f7bfdc84d2f/>PikWizard</a>
</span>
</span>
<span class="image-link">
<span
style="margin: 0 0 20px 0; display: inline-block; vertical-align: middle; width: 100%;"
>
<a
target="_blank"
href="https://pikwizard.com/photo/analyzing-financial-graphs-with-real-time-data-trends/ee93da11a72df987e76f6f7bfdc84d2f/"
style="text-decoration: none; font-size: 10px; margin: 0;"
>
<img src="https://pikwizard.com/pw/medium/ee93da11a72df987e76f6f7bfdc84d2f.jpg" style="margin: 0; width: 100%;" alt="" />
<p style="font-size: 12px; margin: 0;">PikWizard</p>
</a>
</span>
</span>
Free (free of charge)
Free for personal and commercial use.
Author: Awesome Content
Similar Free Stock Images

Premium


Premium

Premium


Premium


Premium


Premium


Premium

Premium


Premium


Premium


Premium


Premium


Premium


Premium

Premium

Premium


Premium


Premium


Premium


Premium

Premium


Premium


Premium

Premium


Premium


Explore More Free Stock Images