- Home >
- Stock Photos >
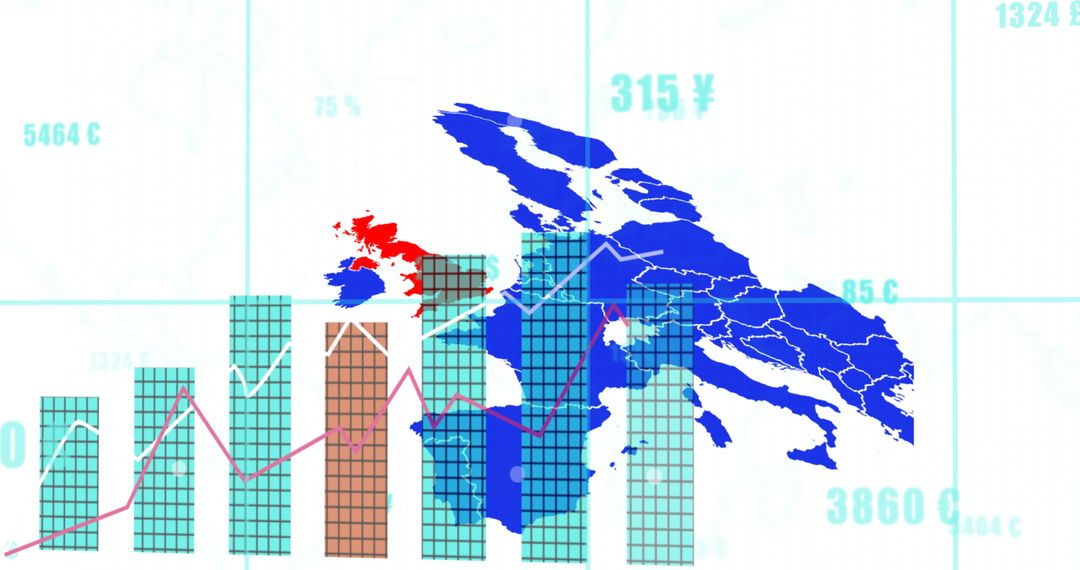
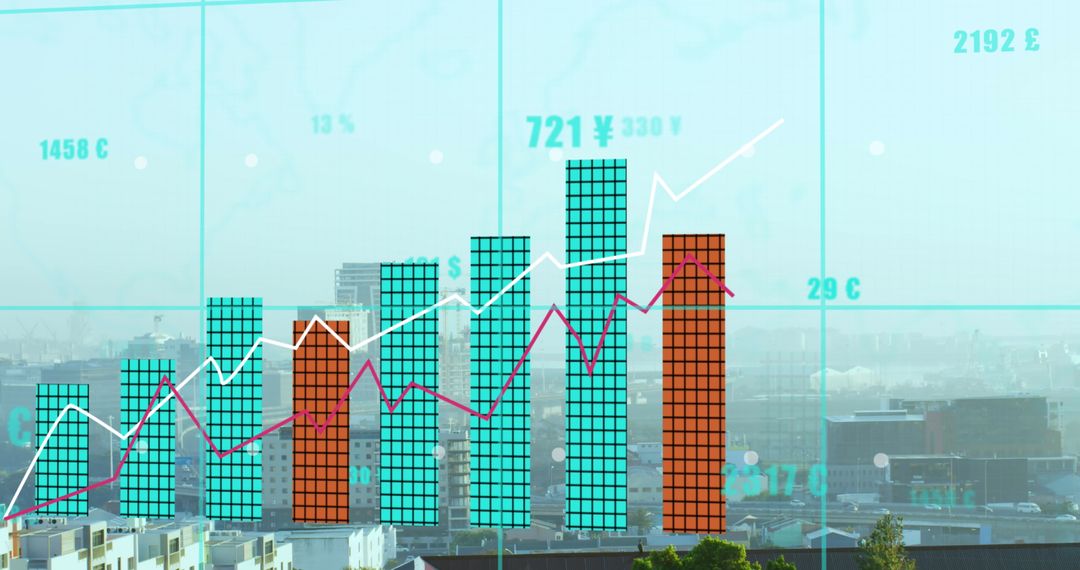
- Analyzing Financial Growth with Data Graphs and Market Indicators
Analyzing Financial Growth with Data Graphs and Market Indicators Image

Visual representation capturing rising trends in finance sectors, ideal for presentations on economic performance, market analytics reports, or business strategy development. Suited for investment firms, trading platforms, and finance-related educational materials.
Powered by 


2
downloads
downloads
Tags:
More
Credit Photo
If you would like to credit the Photo, here are some ways you can do so
Text Link
photo Link
<span class="text-link">
<span>
<a target="_blank" href=https://pikwizard.com/photo/analyzing-financial-growth-with-data-graphs-and-market-indicators/0a75f37de9f5ea2dd6702c3cf5ca3180/>PikWizard</a>
</span>
</span>
<span class="image-link">
<span
style="margin: 0 0 20px 0; display: inline-block; vertical-align: middle; width: 100%;"
>
<a
target="_blank"
href="https://pikwizard.com/photo/analyzing-financial-growth-with-data-graphs-and-market-indicators/0a75f37de9f5ea2dd6702c3cf5ca3180/"
style="text-decoration: none; font-size: 10px; margin: 0;"
>
<img src="https://pikwizard.com/pw/medium/0a75f37de9f5ea2dd6702c3cf5ca3180.jpg" style="margin: 0; width: 100%;" alt="" />
<p style="font-size: 12px; margin: 0;">PikWizard</p>
</a>
</span>
</span>
Free (free of charge)
Free for personal and commercial use.
Author: Creative Art
Similar Free Stock Images
Premium


Premium


Premium


Premium


Premium


Premium


Premium


Premium


Premium


Premium


Premium


Premium


Premium


Premium


Premium


Premium


Premium


Premium


Premium


Premium


Premium


Premium


Premium


Premium