- Home >
- Stock Photos >
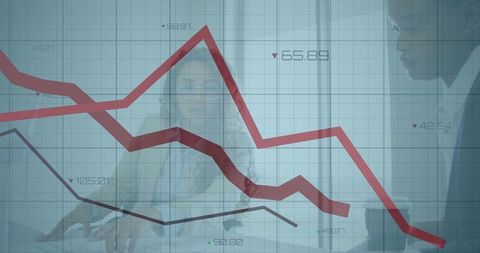
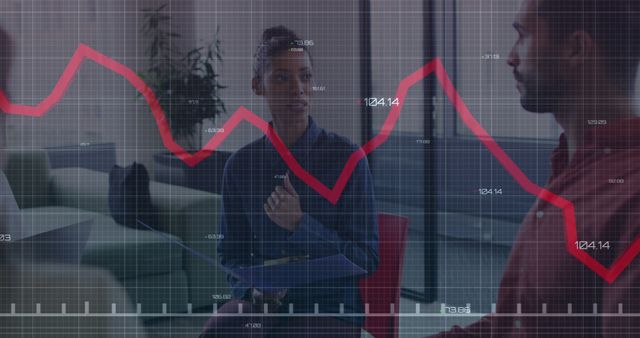
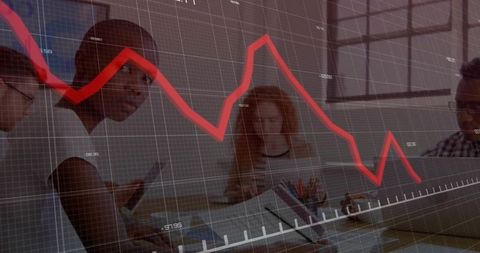
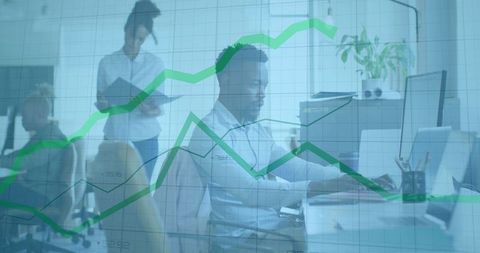
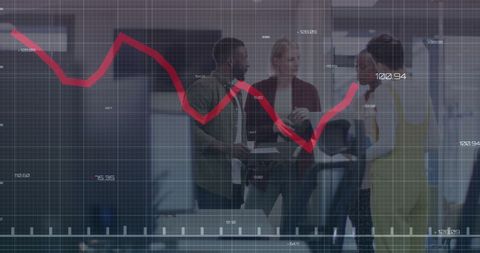
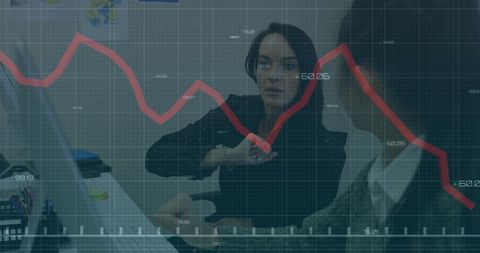
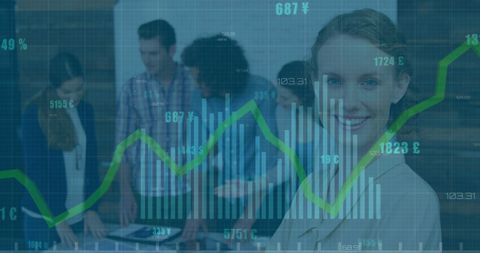
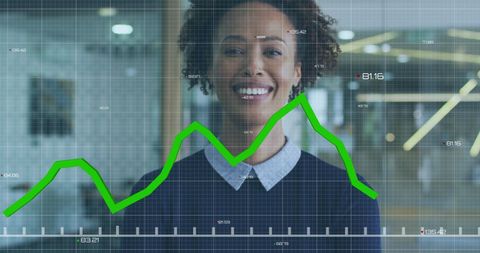
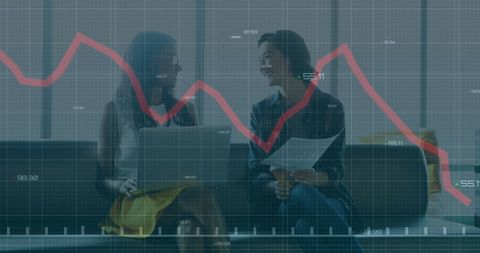
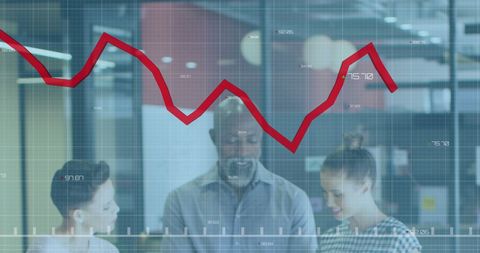
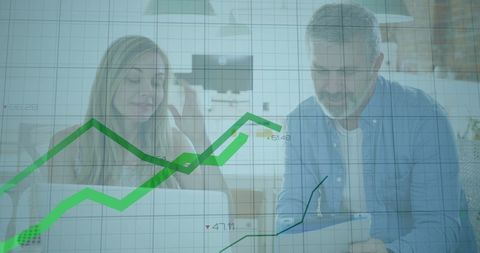
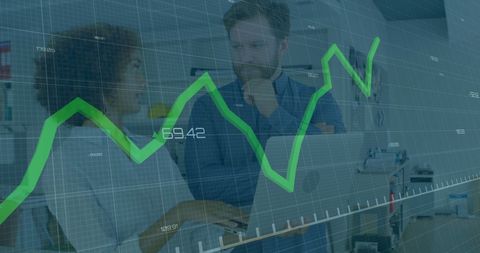
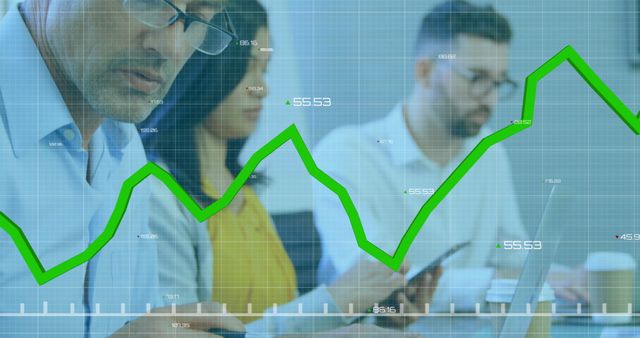
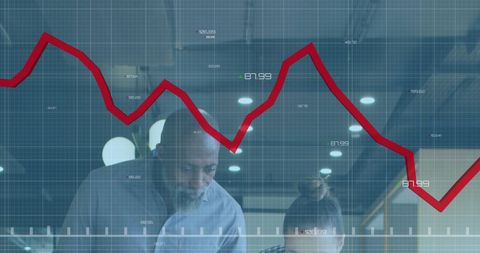
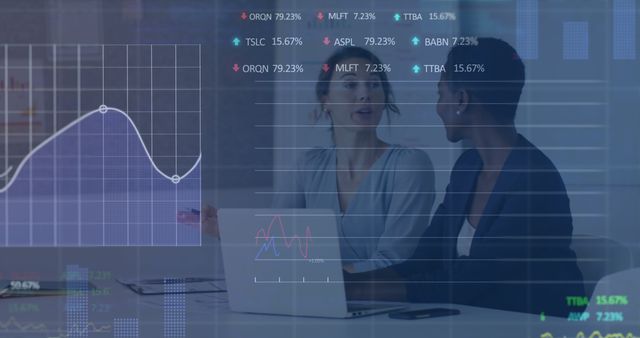
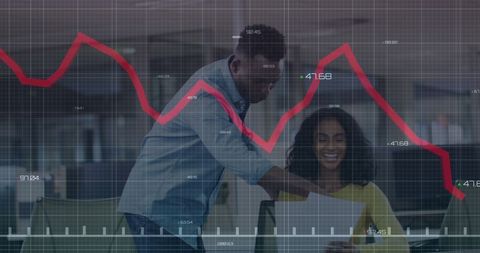
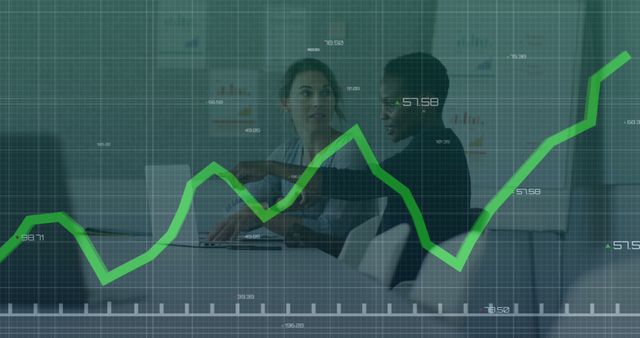
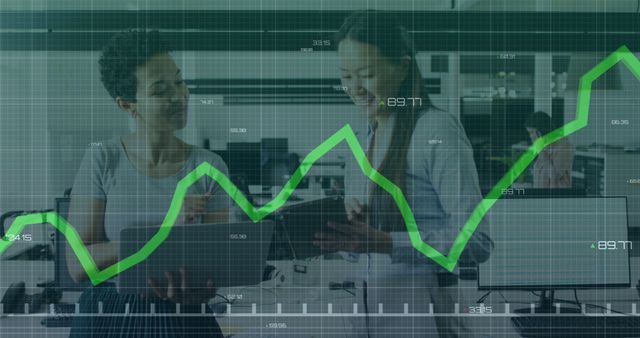
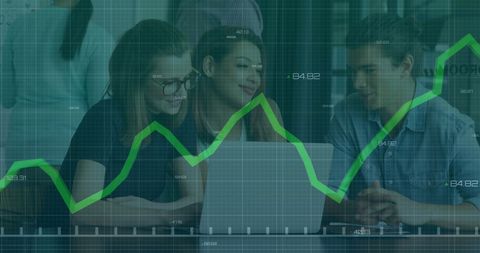
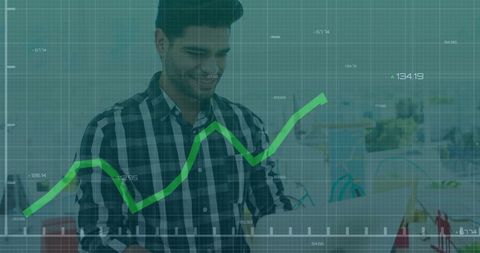
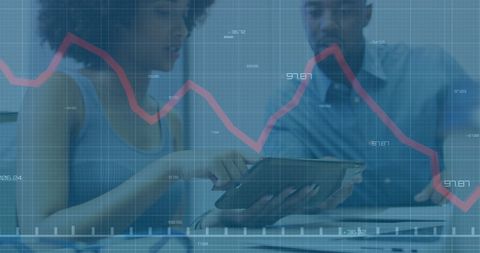
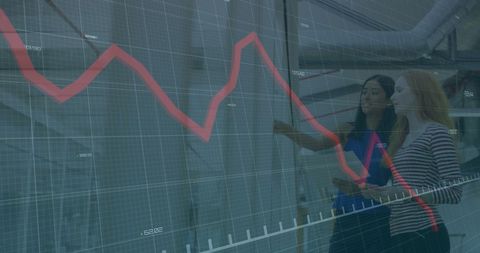
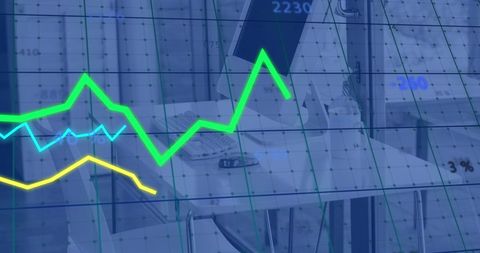
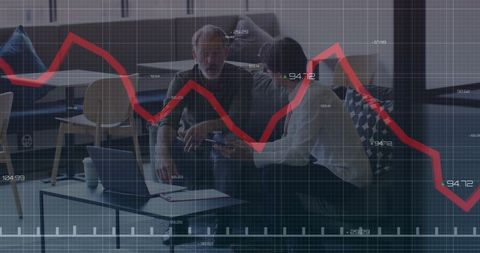
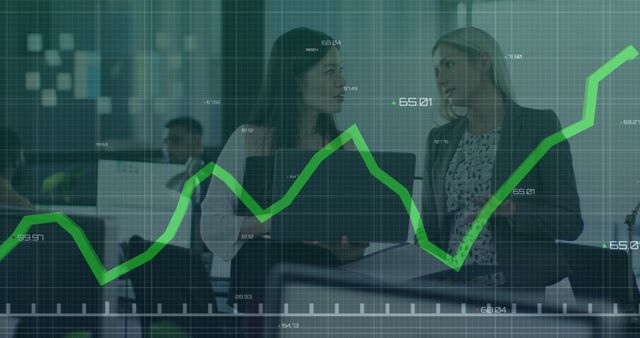
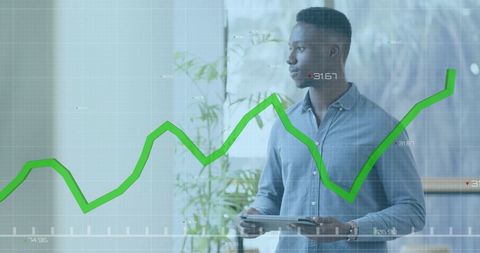
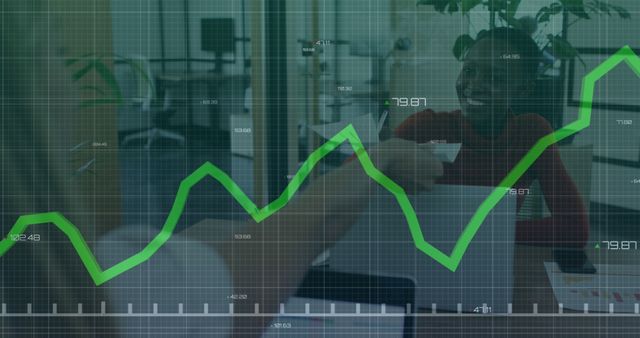
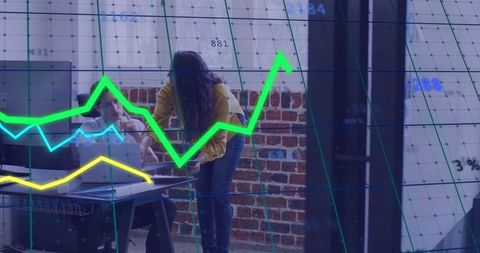
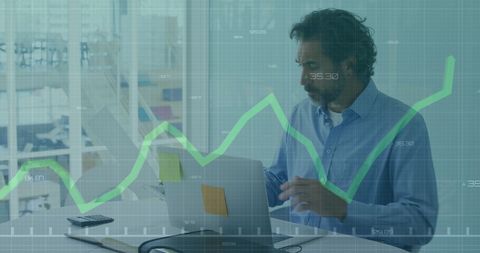
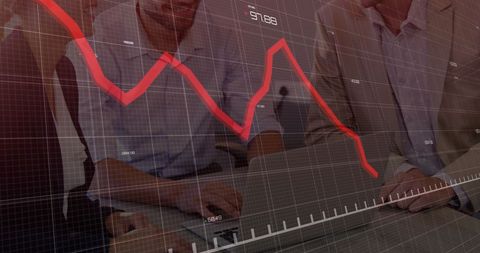
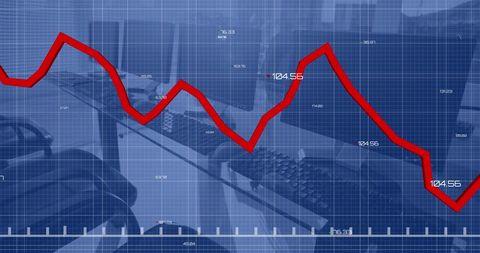
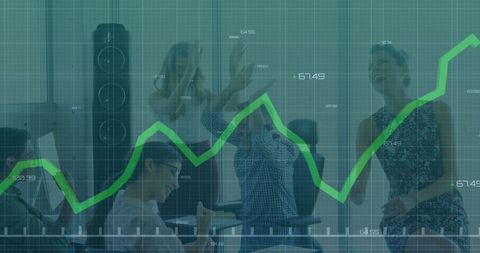
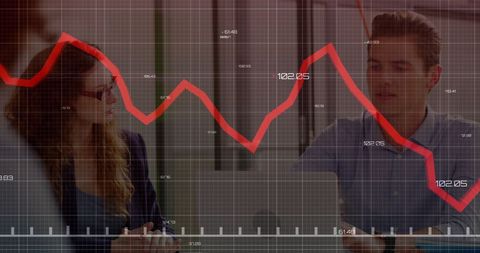
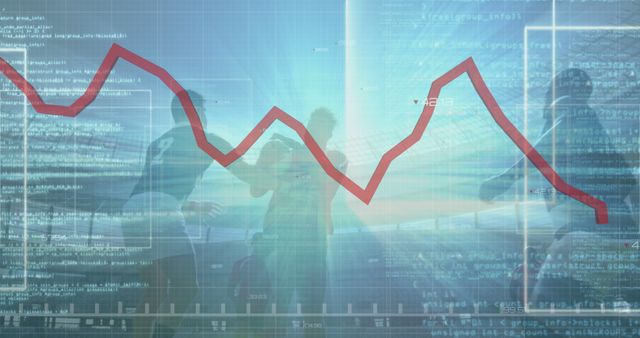
- Analyzing Fluctuating Data Graph with Technology in Office Setting
Analyzing Fluctuating Data Graph with Technology in Office Setting Image
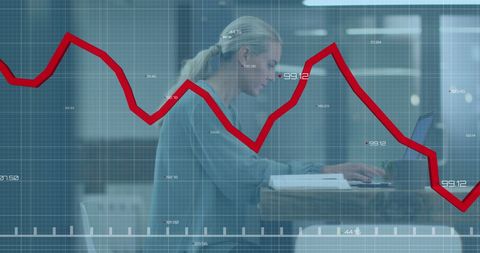
Individual working diligently on laptop superimposed with red fluctuating data graph conveying financial analysis concepts. Image useful for articles on data-driven decisions, financial trends or business strategy presentations.

downloads
Tags:
More
Credit Photo
If you would like to credit the Photo, here are some ways you can do so
Text Link
photo Link
<span class="text-link">
<span>
<a target="_blank" href=https://pikwizard.com/photo/analyzing-fluctuating-data-graph-with-technology-in-office-setting/b03453e2982c899930c3e1e88ab61d62/>PikWizard</a>
</span>
</span>
<span class="image-link">
<span
style="margin: 0 0 20px 0; display: inline-block; vertical-align: middle; width: 100%;"
>
<a
target="_blank"
href="https://pikwizard.com/photo/analyzing-fluctuating-data-graph-with-technology-in-office-setting/b03453e2982c899930c3e1e88ab61d62/"
style="text-decoration: none; font-size: 10px; margin: 0;"
>
<img src="https://pikwizard.com/pw/medium/b03453e2982c899930c3e1e88ab61d62.jpg" style="margin: 0; width: 100%;" alt="" />
<p style="font-size: 12px; margin: 0;">PikWizard</p>
</a>
</span>
</span>
Free (free of charge)
Free for personal and commercial use.
Author: Creative Art