
- Home >
- Stock Photos >
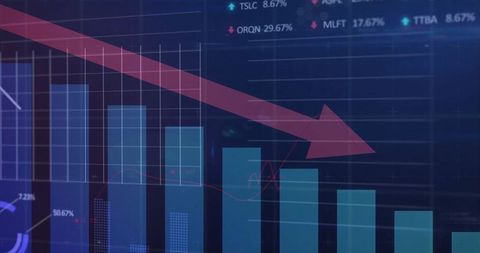
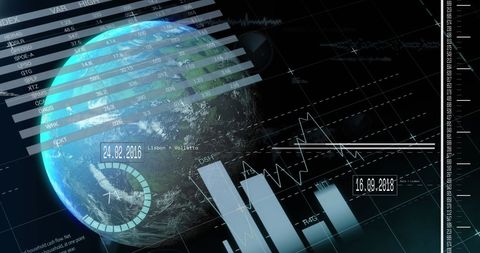
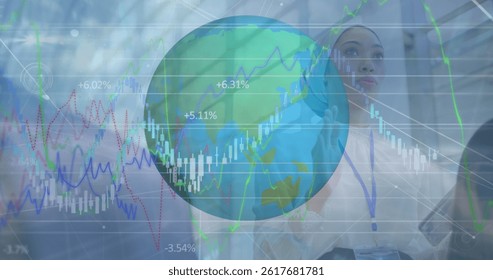
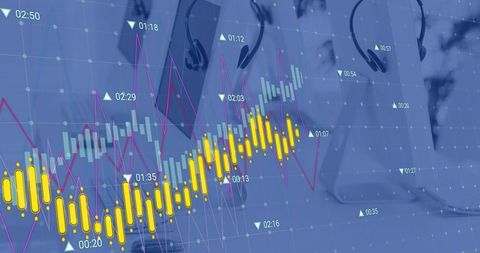
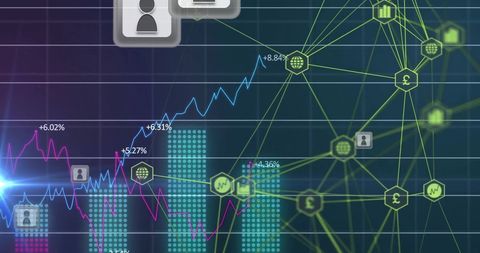
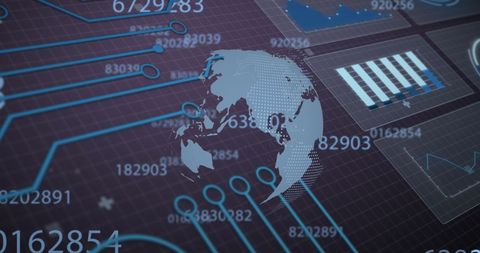
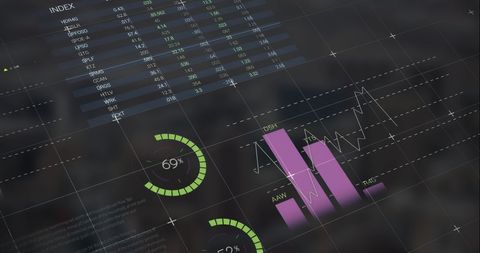
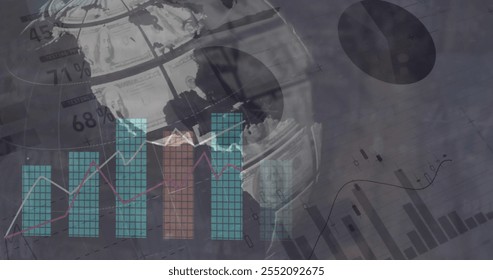
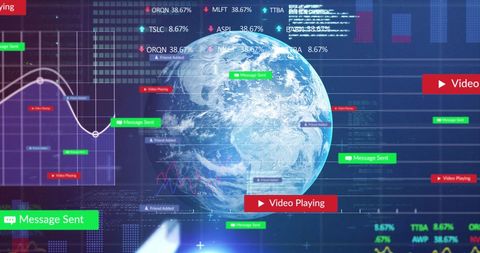
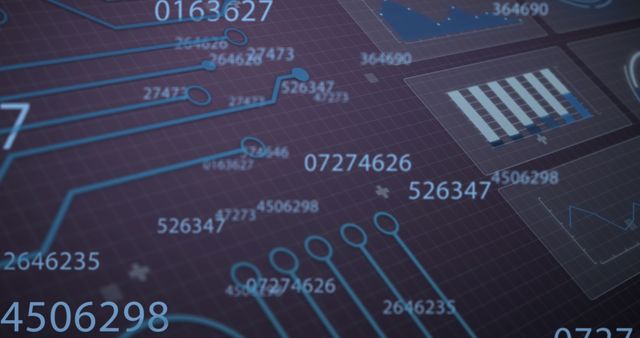
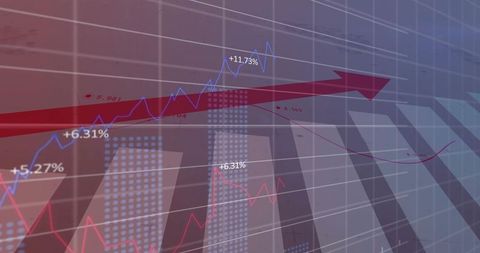
- Analyzing Global Finance Trends with High-Tech Data Visualization
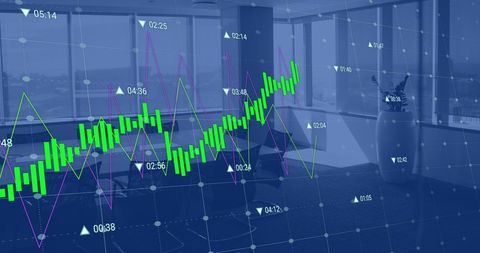
Analyzing Global Finance Trends with High-Tech Data Visualization Image

This composition showcases digital data visualizations depicting financial and economic trends. Featuring bar and line graphs, along with percentages, it emphasizes key factors like energy, value, and investments. Ideal for presentations about economic analysis or reports on global financial performance, offering insight into complex data and wealth trends.
Powered by  - Get 15% off with code: PIKWIZARD15


downloads
Tags:
More
Credit Photo
If you would like to credit the Photo, here are some ways you can do so
Text Link
photo Link
<span class="text-link">
<span>
<a target="_blank" href=https://pikwizard.com/photo/analyzing-global-finance-trends-with-high-tech-data-visualization/bd8fea2ea8a09c6aa21dbf105dfda185/>PikWizard</a>
</span>
</span>
<span class="image-link">
<span
style="margin: 0 0 20px 0; display: inline-block; vertical-align: middle; width: 100%;"
>
<a
target="_blank"
href="https://pikwizard.com/photo/analyzing-global-finance-trends-with-high-tech-data-visualization/bd8fea2ea8a09c6aa21dbf105dfda185/"
style="text-decoration: none; font-size: 10px; margin: 0;"
>
<img src="https://pikwizard.com/pw/medium/bd8fea2ea8a09c6aa21dbf105dfda185.jpg" style="margin: 0; width: 100%;" alt="" />
<p style="font-size: 12px; margin: 0;">PikWizard</p>
</a>
</span>
</span>
Free (free of charge)
Free for personal and commercial use.
Author: Creative Art
Similar Free Stock Images
Premium


Premium


Premium


Premium


Premium


Premium


Premium


Premium

Premium

Premium


Premium


Premium


Premium


Premium

Premium


Premium

Premium


Premium


Premium


Premium


Premium


Premium


Premium


Premium


Premium


Explore More Free Stock Images