
- Home >
- Stock Photos >
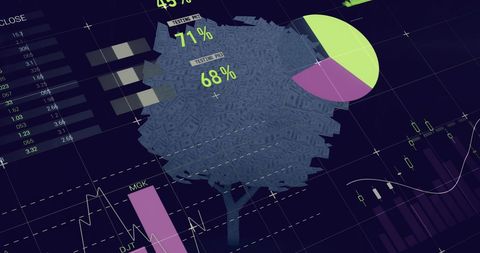
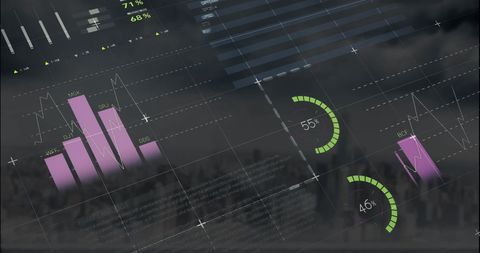
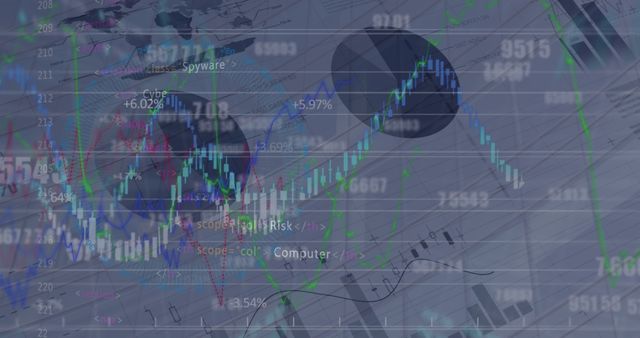
- Analyzing Global Financial Data Visualization
Analyzing Global Financial Data Visualization Image

Complex graphical representation highlighting financial data analysis and statistics. Useful for illustrating themes in global finance and economics. Perfect for presentations, financial reports, and informational websites focused on data-driven insights or stock market analysis.
Powered by 


downloads
Tags:
More
Credit Photo
If you would like to credit the Photo, here are some ways you can do so
Text Link
photo Link
<span class="text-link">
<span>
<a target="_blank" href=https://pikwizard.com/photo/analyzing-global-financial-data-visualization/7312b24ccd4dc8199bdc57dc86fa0885/>PikWizard</a>
</span>
</span>
<span class="image-link">
<span
style="margin: 0 0 20px 0; display: inline-block; vertical-align: middle; width: 100%;"
>
<a
target="_blank"
href="https://pikwizard.com/photo/analyzing-global-financial-data-visualization/7312b24ccd4dc8199bdc57dc86fa0885/"
style="text-decoration: none; font-size: 10px; margin: 0;"
>
<img src="https://pikwizard.com/pw/medium/7312b24ccd4dc8199bdc57dc86fa0885.jpg" style="margin: 0; width: 100%;" alt="" />
<p style="font-size: 12px; margin: 0;">PikWizard</p>
</a>
</span>
</span>
Free (free of charge)
Free for personal and commercial use.
Author: Authentic Images
Similar Free Stock Images

Premium


Premium


Premium


Premium


Premium


Premium


Premium


Premium


Premium

Premium


Premium


Premium


Premium

Premium


Premium


Premium


Premium


Premium


Premium


Premium


Premium


Premium


Premium


Premium


Premium


Explore More Free Stock Images