- Home >
- Stock Photos >
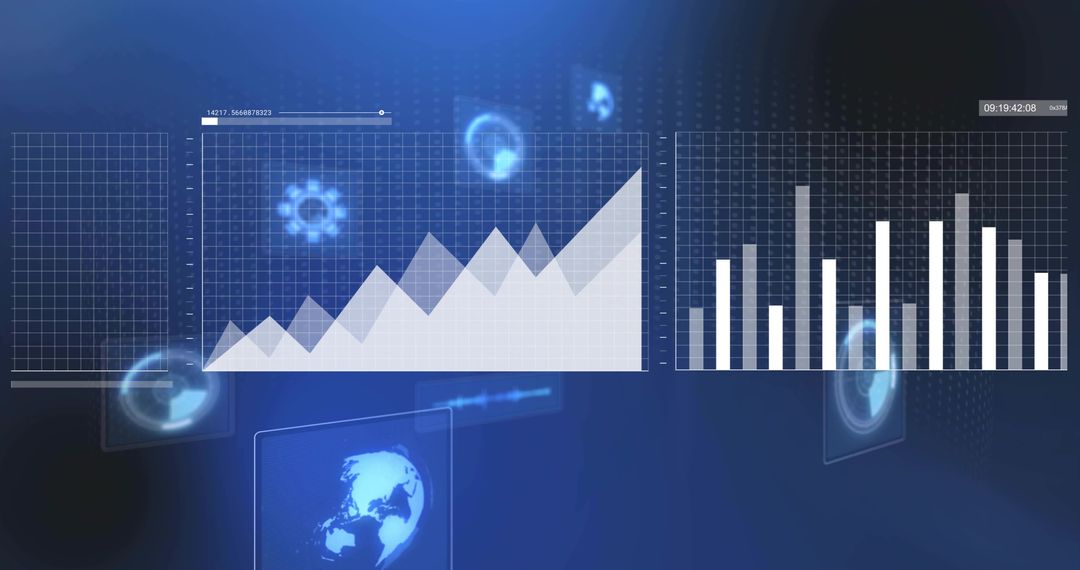
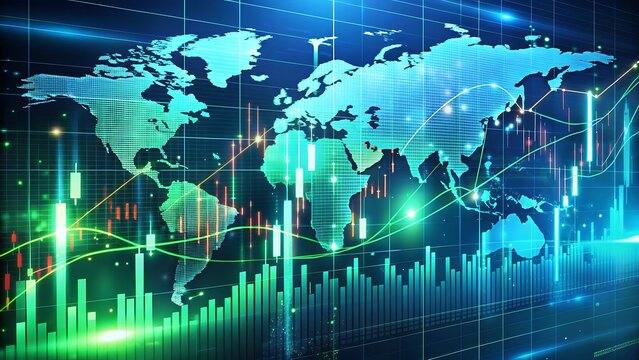
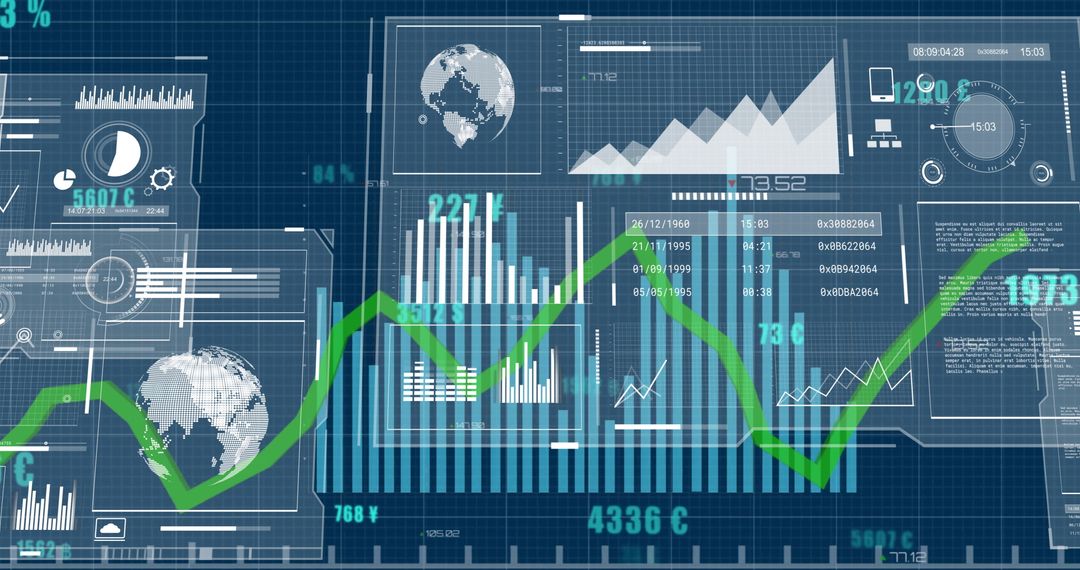
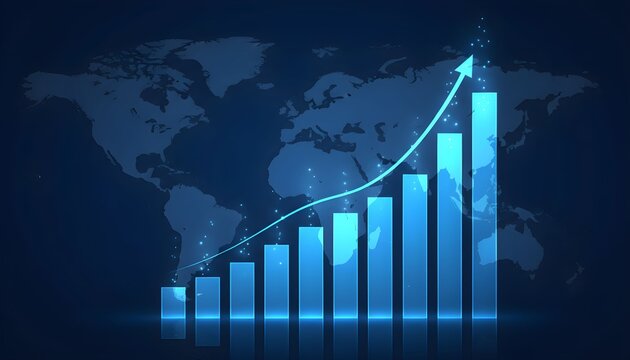
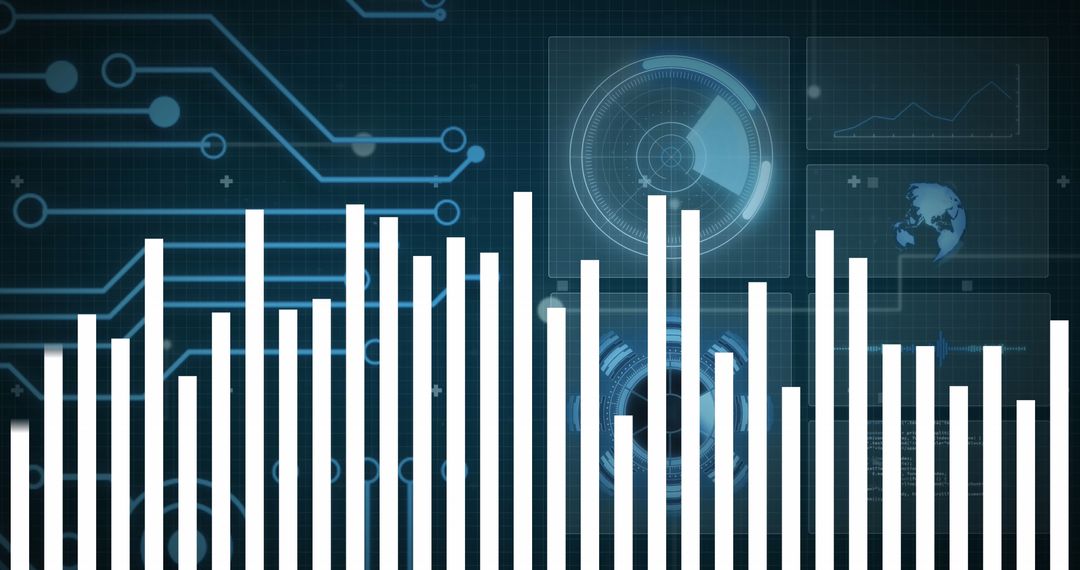
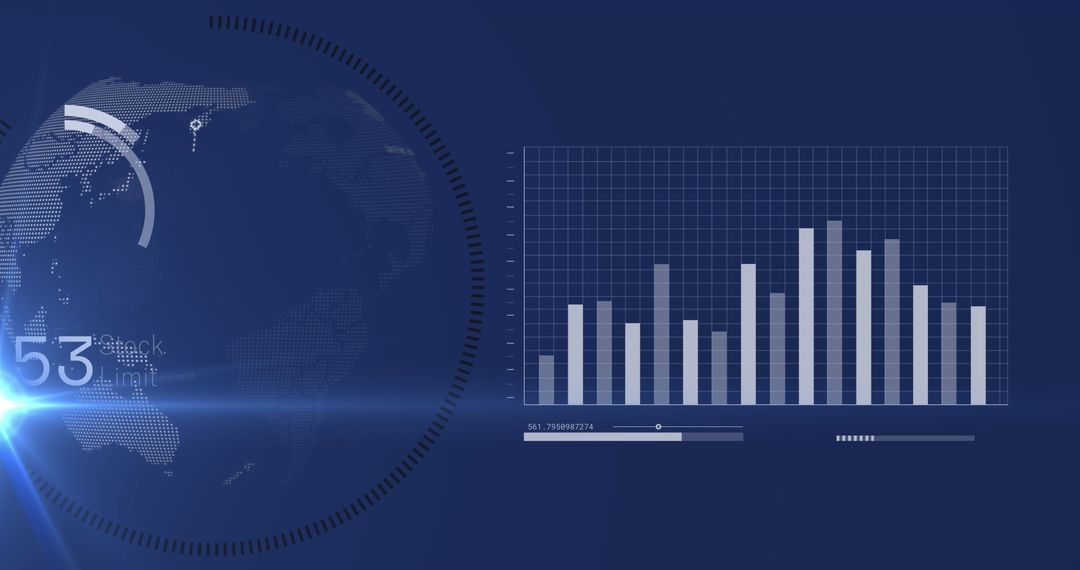
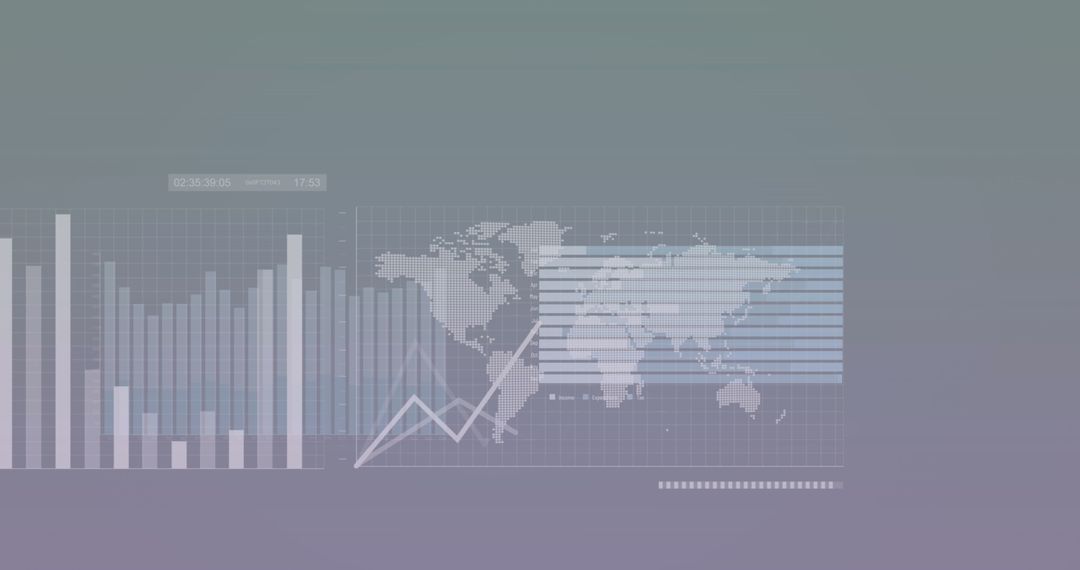
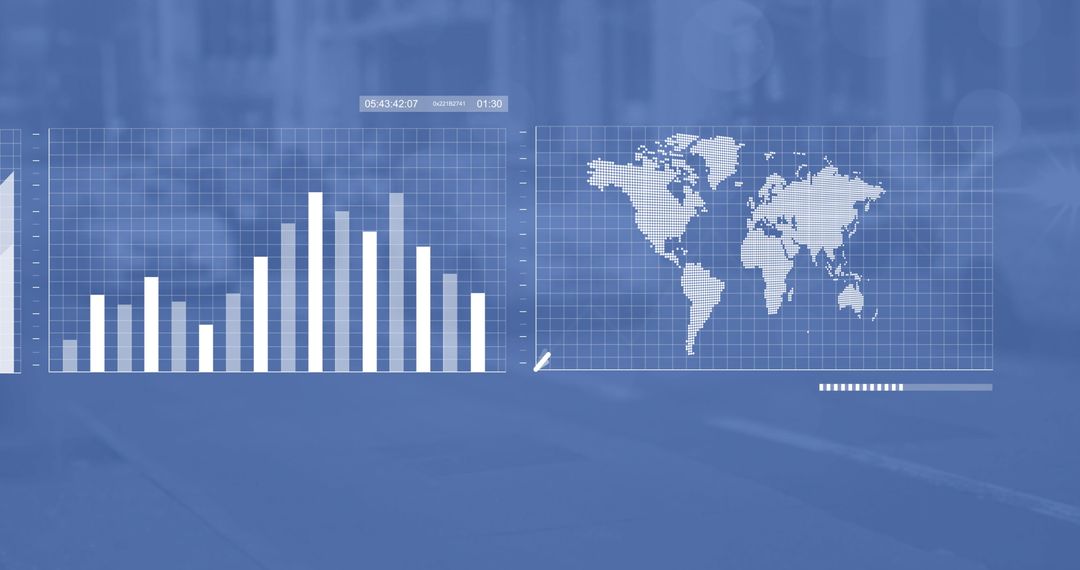
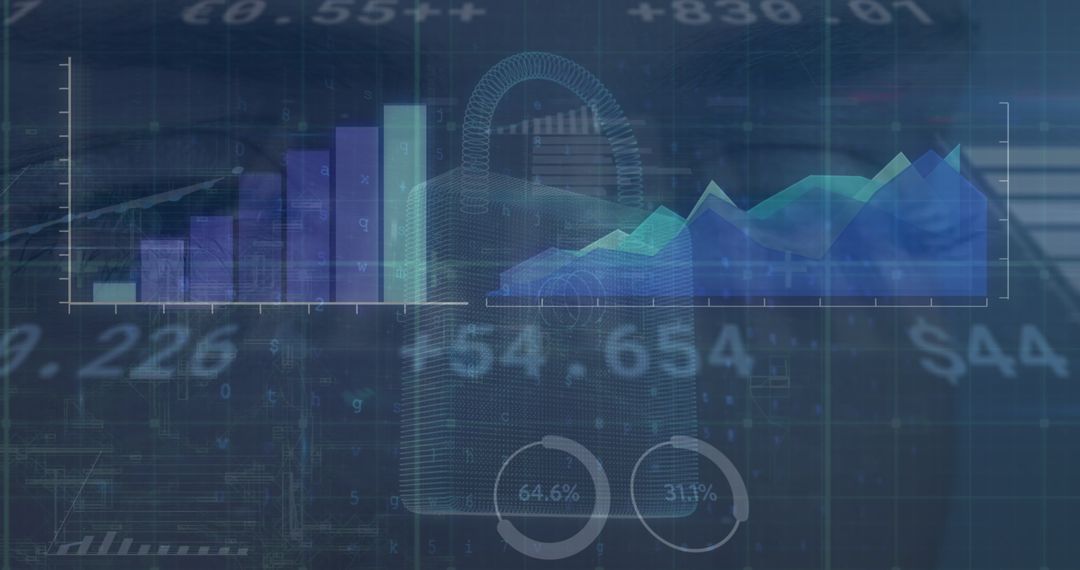
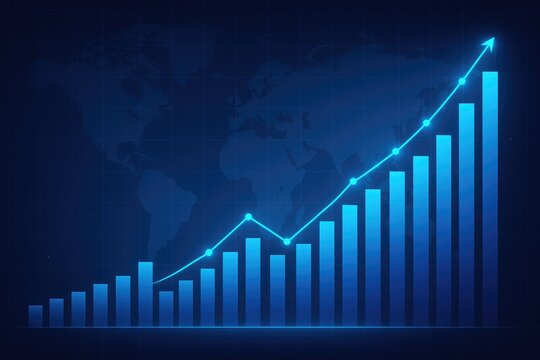
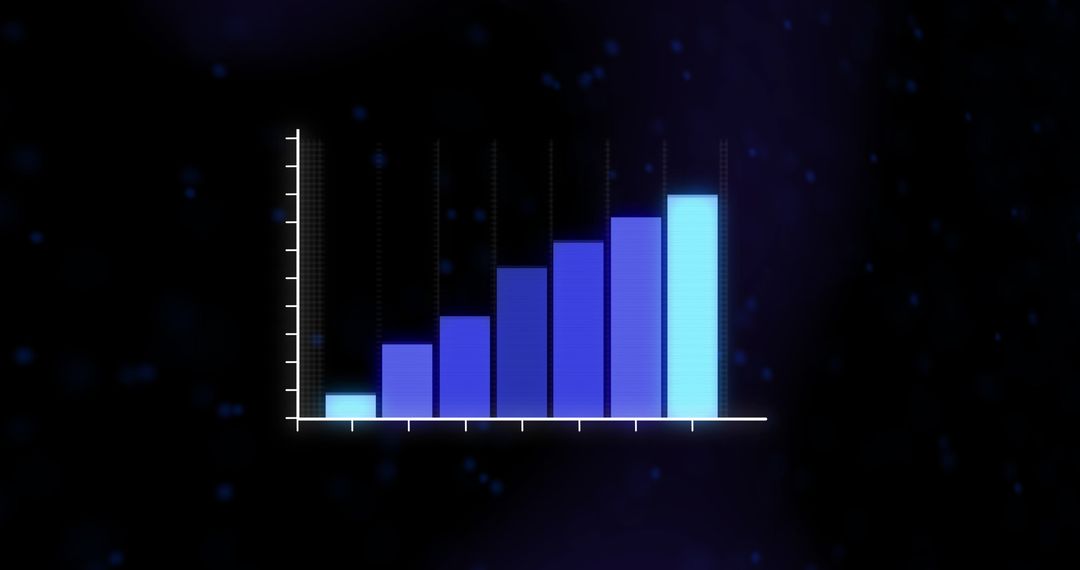
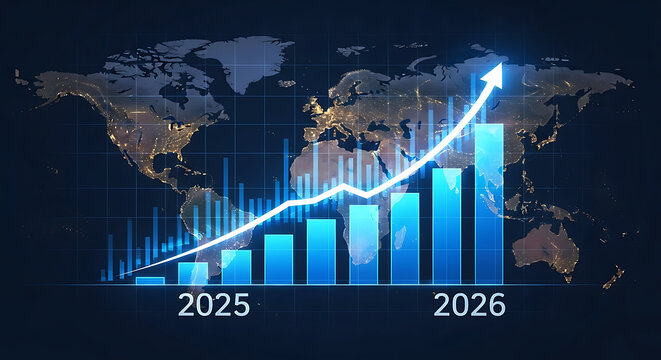
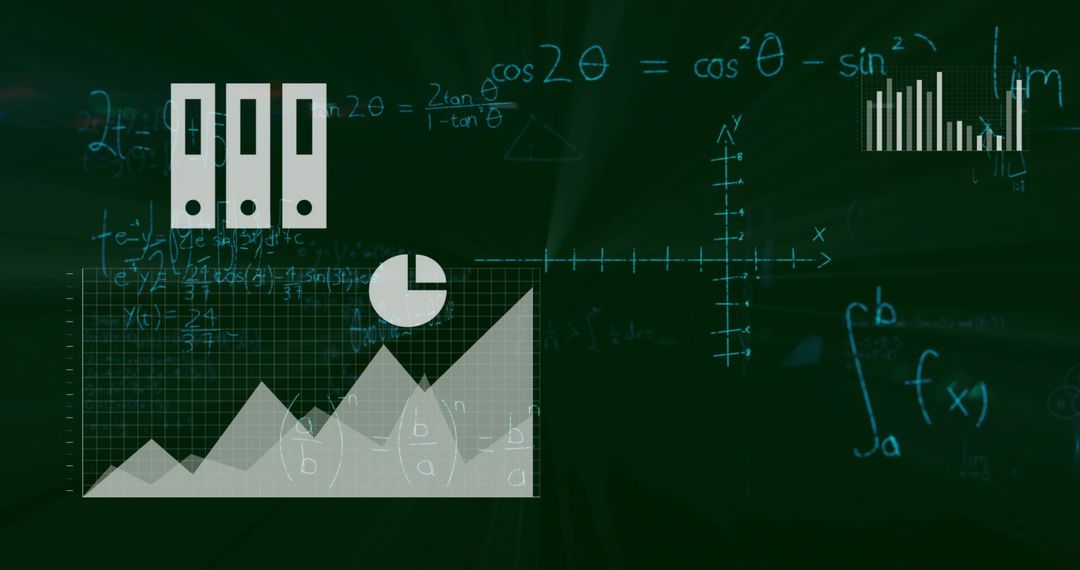
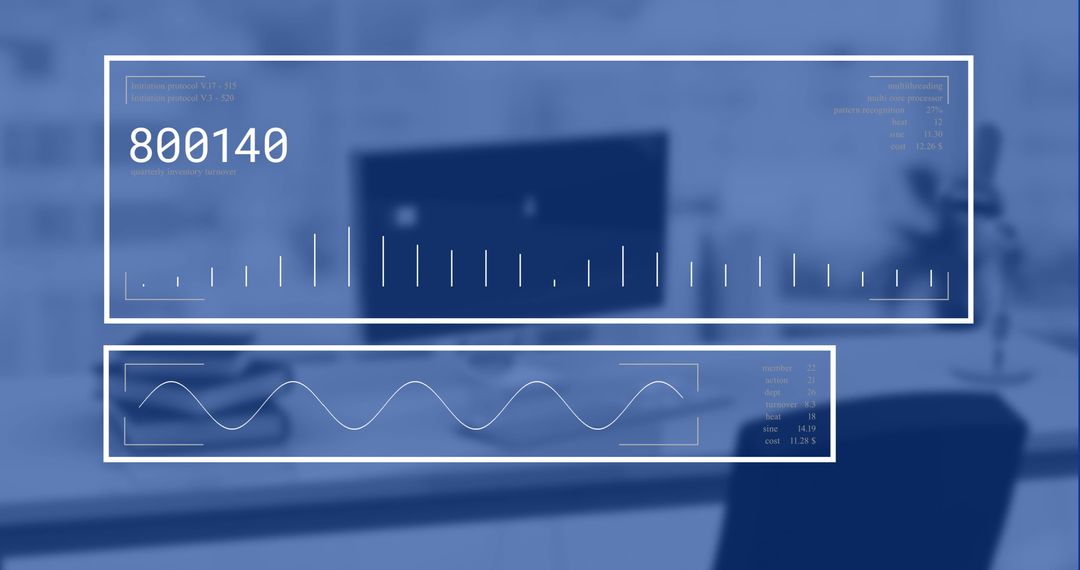
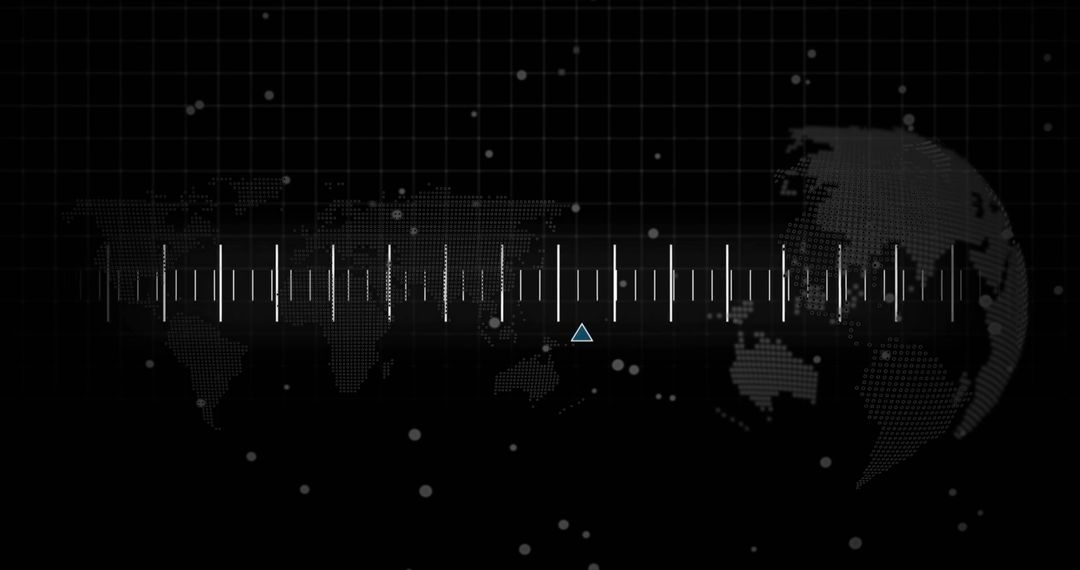
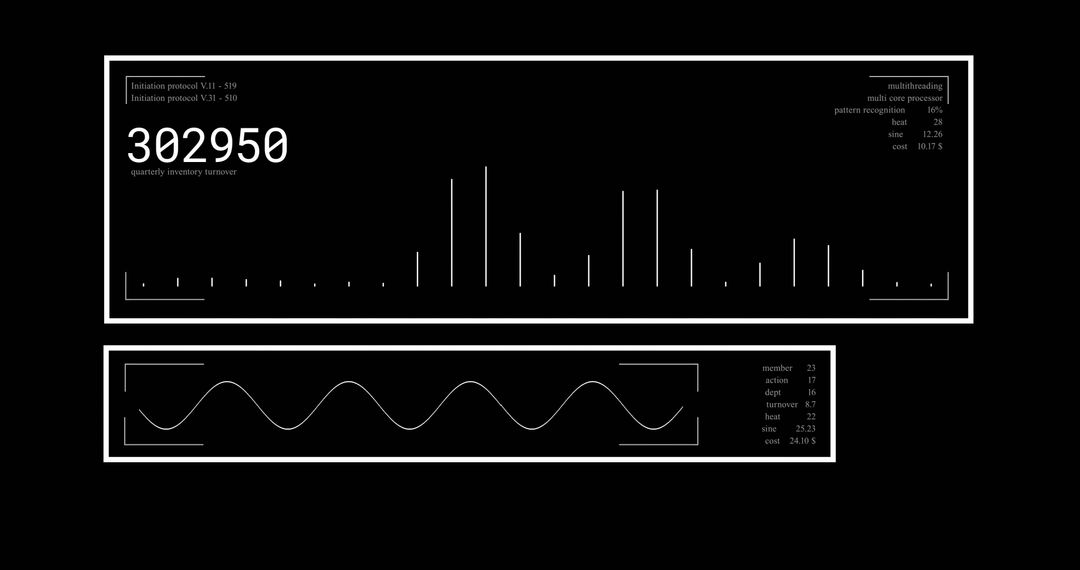
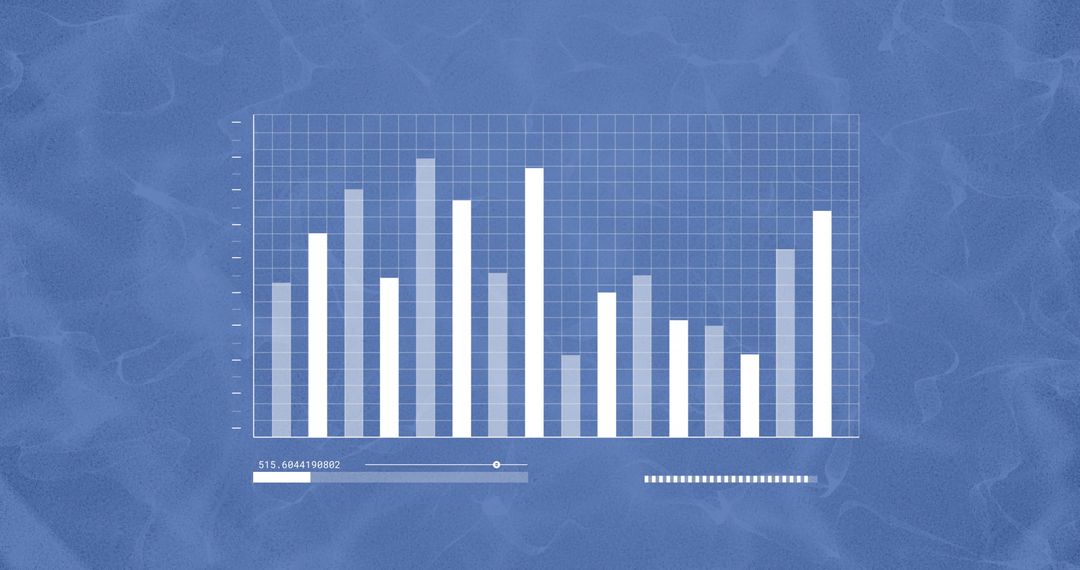
- Analyzing Global Financial Data with Digital Bar Graphs
Analyzing Global Financial Data with Digital Bar Graphs Image

Visual representations of financial data combined with a world map on a dark navy background are highlighted, depicting globalization and digital analytics. Ideal for economic reports, business presentations, or technology-focused infographics that showcase financial trends or market analysis insights.
Powered by 


4
downloads
downloads
Tags:
More
Credit Photo
If you would like to credit the Photo, here are some ways you can do so
Text Link
photo Link
<span class="text-link">
<span>
<a target="_blank" href=https://pikwizard.com/photo/analyzing-global-financial-data-with-digital-bar-graphs/9fb54c2b55b8771c3bbd4d36f4220c95/>PikWizard</a>
</span>
</span>
<span class="image-link">
<span
style="margin: 0 0 20px 0; display: inline-block; vertical-align: middle; width: 100%;"
>
<a
target="_blank"
href="https://pikwizard.com/photo/analyzing-global-financial-data-with-digital-bar-graphs/9fb54c2b55b8771c3bbd4d36f4220c95/"
style="text-decoration: none; font-size: 10px; margin: 0;"
>
<img src="https://pikwizard.com/pw/medium/9fb54c2b55b8771c3bbd4d36f4220c95.jpg" style="margin: 0; width: 100%;" alt="" />
<p style="font-size: 12px; margin: 0;">PikWizard</p>
</a>
</span>
</span>
Free (free of charge)
Free for personal and commercial use.
Author: Authentic Images
Similar Free Stock Images
Premium


Premium


Premium

Premium


Premium


Premium


Premium


Premium


Premium


Premium


Premium


Premium


Premium


Premium


Premium


Premium


Premium


Premium


Premium


Premium


Premium


Premium

Premium


Premium