
- Home >
- Stock Photos >
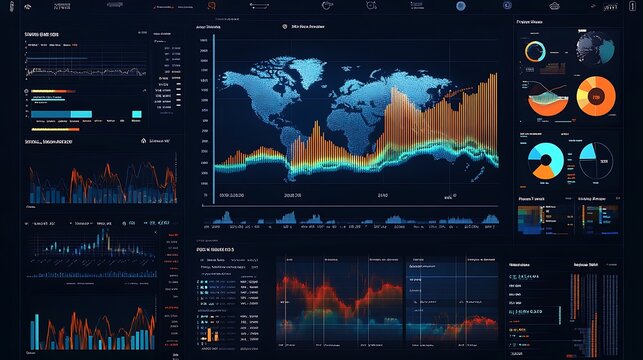
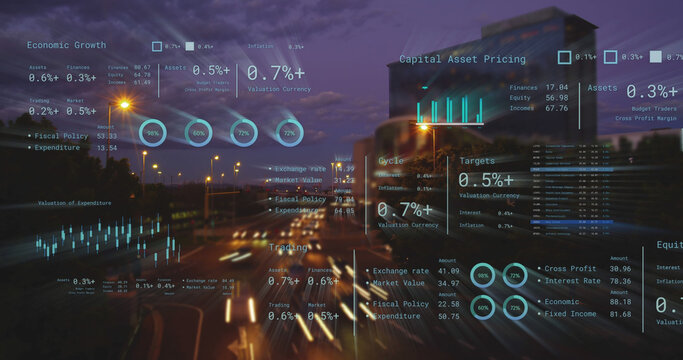
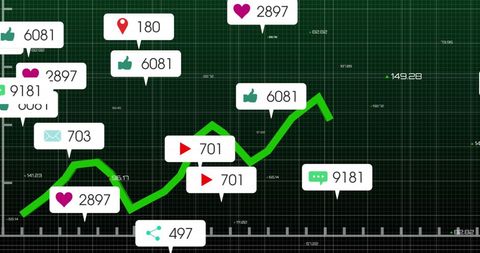
- Analyzing Global Financial Data with Interactive Technology Panels
Analyzing Global Financial Data with Interactive Technology Panels Image
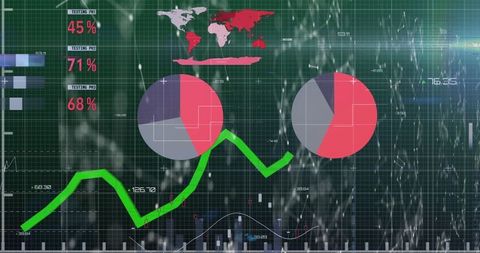
Charts and graphs portraying global financial data are displayed in digital interface scenery, combining interactive technology elements. Suitable for illustrating finance technology topics or data science visuals in brochures, financial reports, or presentations.
Powered by 


downloads
Tags:
More
Credit Photo
If you would like to credit the Photo, here are some ways you can do so
Text Link
photo Link
<span class="text-link">
<span>
<a target="_blank" href=https://pikwizard.com/photo/analyzing-global-financial-data-with-interactive-technology-panels/d81e3ad3bdf62a675ed6143536a3ebb4/>PikWizard</a>
</span>
</span>
<span class="image-link">
<span
style="margin: 0 0 20px 0; display: inline-block; vertical-align: middle; width: 100%;"
>
<a
target="_blank"
href="https://pikwizard.com/photo/analyzing-global-financial-data-with-interactive-technology-panels/d81e3ad3bdf62a675ed6143536a3ebb4/"
style="text-decoration: none; font-size: 10px; margin: 0;"
>
<img src="https://pikwizard.com/pw/medium/d81e3ad3bdf62a675ed6143536a3ebb4.jpg" style="margin: 0; width: 100%;" alt="" />
<p style="font-size: 12px; margin: 0;">PikWizard</p>
</a>
</span>
</span>
Free (free of charge)
Free for personal and commercial use.
Author: Authentic Images
Similar Free Stock Images

Premium


Premium


Premium


Premium


Premium


Premium


Premium


Premium


Premium


Premium


Premium


Premium

Premium


Premium


Premium

Premium


Premium


Premium


Premium


Premium


Premium


Premium


Premium


Premium


Premium


Explore More Free Stock Images