- Home >
- Stock Photos >
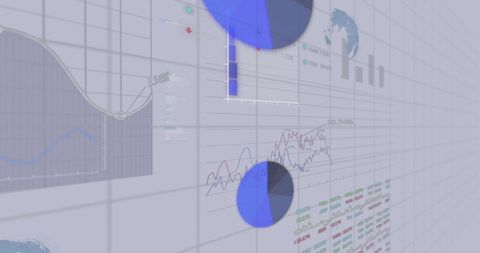
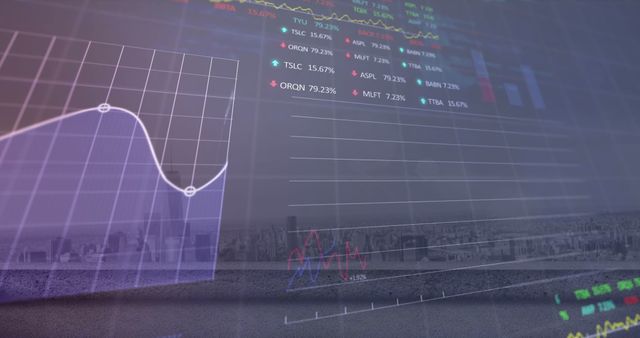
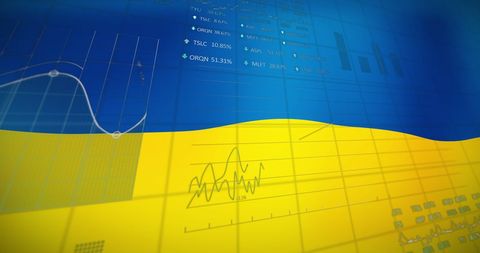
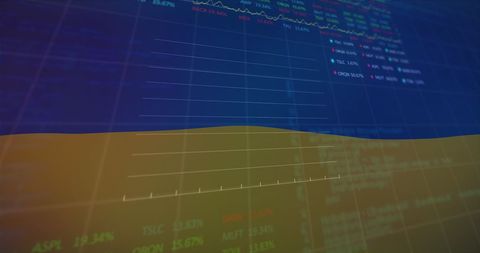
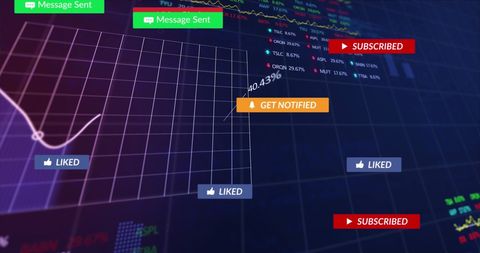
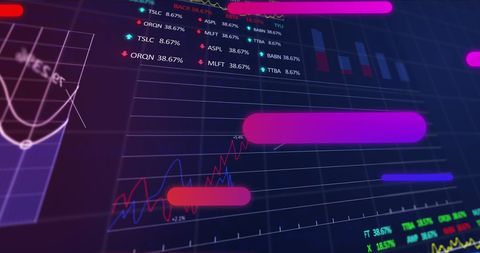
- Analyzing Global Financial Markets with Data Visualization
Analyzing Global Financial Markets with Data Visualization Image

Image depicts digital visualization of financial data analysis with colorful graphs and charts framing the dynamics of global markets. Useful for illustrating financial reports, market analysis guides, investment strategy articles, or any content dealing with economics and data handling in today's high-tech age.

downloads
Tags:
More
Credit Photo
If you would like to credit the Photo, here are some ways you can do so
Text Link
photo Link
<span class="text-link">
<span>
<a target="_blank" href=https://pikwizard.com/photo/analyzing-global-financial-markets-with-data-visualization/05712545221568d708e19cd6a3e61e03/>PikWizard</a>
</span>
</span>
<span class="image-link">
<span
style="margin: 0 0 20px 0; display: inline-block; vertical-align: middle; width: 100%;"
>
<a
target="_blank"
href="https://pikwizard.com/photo/analyzing-global-financial-markets-with-data-visualization/05712545221568d708e19cd6a3e61e03/"
style="text-decoration: none; font-size: 10px; margin: 0;"
>
<img src="https://pikwizard.com/pw/medium/05712545221568d708e19cd6a3e61e03.jpg" style="margin: 0; width: 100%;" alt="" />
<p style="font-size: 12px; margin: 0;">PikWizard</p>
</a>
</span>
</span>
Free (free of charge)
Free for personal and commercial use.
Author: People Creations