- Home >
- Stock Photos >
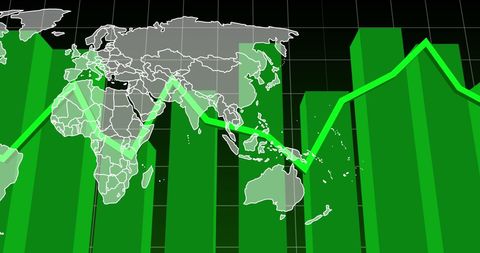
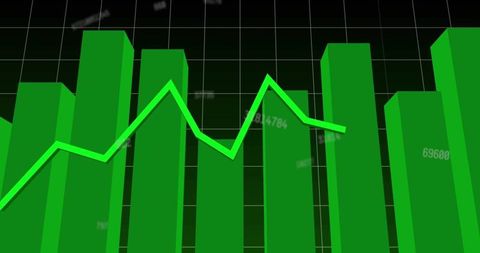
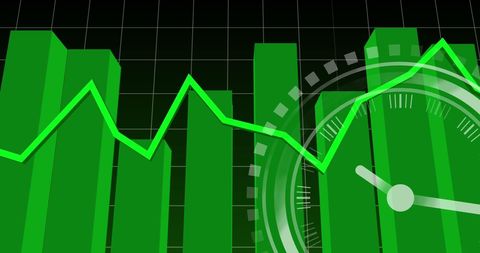
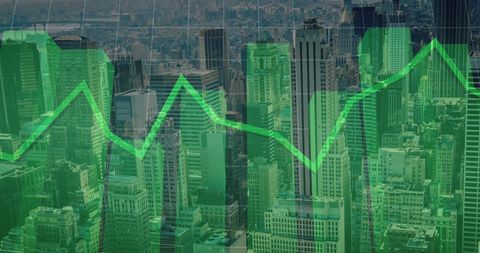
- Analyzing Network Connections Over Financial Data
Analyzing Network Connections Over Financial Data Image

Illustrates network connections intertwining with financial data showing bar graphs. Represents trends, economic analysis, or digital transformation, ideal for use in financial reports, technology blogs, presentations worsheet hobbyists mags website imagery frontend.

downloads
Tags:
More
Credit Photo
If you would like to credit the Photo, here are some ways you can do so
Text Link
photo Link
<span class="text-link">
<span>
<a target="_blank" href=https://pikwizard.com/photo/analyzing-network-connections-over-financial-data/dba9b0c87f2e99961780202929162218/>PikWizard</a>
</span>
</span>
<span class="image-link">
<span
style="margin: 0 0 20px 0; display: inline-block; vertical-align: middle; width: 100%;"
>
<a
target="_blank"
href="https://pikwizard.com/photo/analyzing-network-connections-over-financial-data/dba9b0c87f2e99961780202929162218/"
style="text-decoration: none; font-size: 10px; margin: 0;"
>
<img src="https://pikwizard.com/pw/medium/dba9b0c87f2e99961780202929162218.jpg" style="margin: 0; width: 100%;" alt="" />
<p style="font-size: 12px; margin: 0;">PikWizard</p>
</a>
</span>
</span>
Free (free of charge)
Free for personal and commercial use.
Author: Creative Art