
- Home >
- Stock Photos >
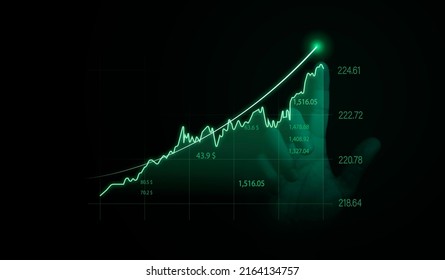
- Analyzing Real-Time Stock Market Data with Digital Interface
Analyzing Real-Time Stock Market Data with Digital Interface Image

Digital interface showing stock tickers and graphs offers concepts for business strategy and financial analysis. Useful in presentations on finance trends and market insights, allowing viewers to visualize data-driven decision-making processes.
Powered by  - Get 15% off with code: PIKWIZARD15


downloads
Tags:
More
Credit Photo
If you would like to credit the Photo, here are some ways you can do so
Text Link
photo Link
<span class="text-link">
<span>
<a target="_blank" href=https://pikwizard.com/photo/analyzing-real-time-stock-market-data-with-digital-interface/d4aa44b9ed65e075c171e0849c7b9740/>PikWizard</a>
</span>
</span>
<span class="image-link">
<span
style="margin: 0 0 20px 0; display: inline-block; vertical-align: middle; width: 100%;"
>
<a
target="_blank"
href="https://pikwizard.com/photo/analyzing-real-time-stock-market-data-with-digital-interface/d4aa44b9ed65e075c171e0849c7b9740/"
style="text-decoration: none; font-size: 10px; margin: 0;"
>
<img src="https://pikwizard.com/pw/medium/d4aa44b9ed65e075c171e0849c7b9740.jpg" style="margin: 0; width: 100%;" alt="" />
<p style="font-size: 12px; margin: 0;">PikWizard</p>
</a>
</span>
</span>
Free (free of charge)
Free for personal and commercial use.
Author: Authentic Images
Similar Free Stock Images

Premium


Premium

Premium


Premium


Premium

Premium


Premium

Premium


Premium


Premium


Premium

Premium


Premium


Premium


Premium


Premium


Premium


Premium


Premium

Premium

Premium


Premium


Premium

Premium


Premium


Explore More Free Stock Images