- Home >
- Stock Photos >
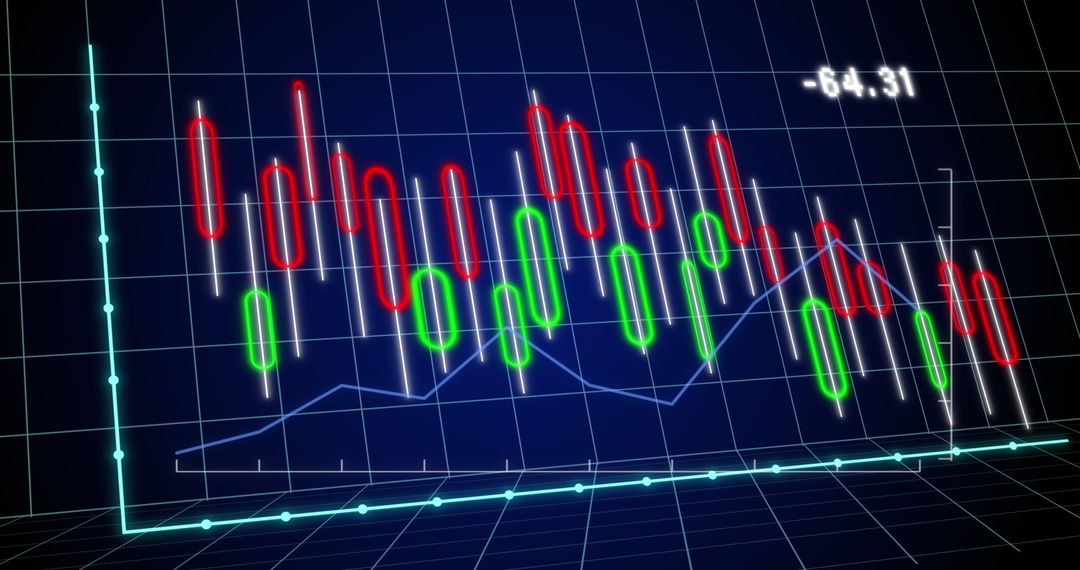
- Analyzing Stock Market Trends with Candlestick Chart and Data Visualization
Analyzing Stock Market Trends with Candlestick Chart and Data Visualization Image

Displaying dynamic movement of stock prices with visual representation like candlesticks and trend lines. Ideal for illustrating financial articles, education on trading strategies, or visuals on forecasting market behavior. Useful for websites focusing on investment opportunities or offering trading advice.
Powered by 


2
downloads
downloads
Tags:
More
Credit Photo
If you would like to credit the Photo, here are some ways you can do so
Text Link
photo Link
<span class="text-link">
<span>
<a target="_blank" href=https://pikwizard.com/photo/analyzing-stock-market-trends-with-candlestick-chart-and-data-visualization/214252c056df3ece0c2cb25ef00b3472/>PikWizard</a>
</span>
</span>
<span class="image-link">
<span
style="margin: 0 0 20px 0; display: inline-block; vertical-align: middle; width: 100%;"
>
<a
target="_blank"
href="https://pikwizard.com/photo/analyzing-stock-market-trends-with-candlestick-chart-and-data-visualization/214252c056df3ece0c2cb25ef00b3472/"
style="text-decoration: none; font-size: 10px; margin: 0;"
>
<img src="https://pikwizard.com/pw/medium/214252c056df3ece0c2cb25ef00b3472.jpg" style="margin: 0; width: 100%;" alt="" />
<p style="font-size: 12px; margin: 0;">PikWizard</p>
</a>
</span>
</span>
Free (free of charge)
Free for personal and commercial use.
Author: Authentic Images