
- Home >
- Stock Photos >
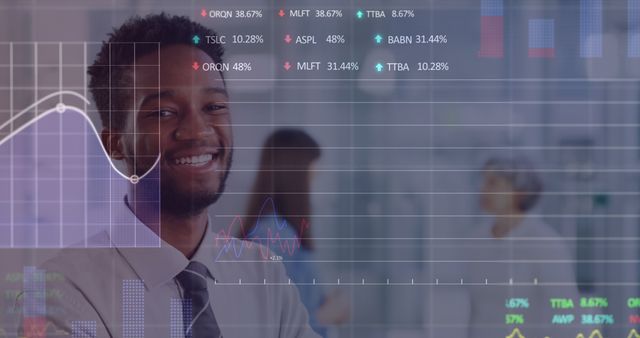
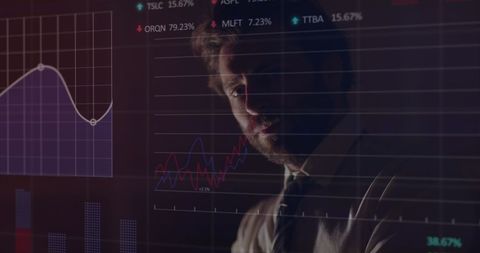
- Analyzing Stock Market Trends with Interactive Data Screen
Analyzing Stock Market Trends with Interactive Data Screen Image

African American man interacting with futuristic digital dashboard displaying stock market graphs and data. Useful for financial services promotion, technology integration in finance, business growth visualization, investment strategies, and market research representation.
Powered by 


downloads
Tags:
More
Credit Photo
If you would like to credit the Photo, here are some ways you can do so
Text Link
photo Link
<span class="text-link">
<span>
<a target="_blank" href=https://pikwizard.com/photo/analyzing-stock-market-trends-with-interactive-data-screen/a58530daf3f83209252b424886084d2b/>PikWizard</a>
</span>
</span>
<span class="image-link">
<span
style="margin: 0 0 20px 0; display: inline-block; vertical-align: middle; width: 100%;"
>
<a
target="_blank"
href="https://pikwizard.com/photo/analyzing-stock-market-trends-with-interactive-data-screen/a58530daf3f83209252b424886084d2b/"
style="text-decoration: none; font-size: 10px; margin: 0;"
>
<img src="https://pikwizard.com/pw/medium/a58530daf3f83209252b424886084d2b.jpg" style="margin: 0; width: 100%;" alt="" />
<p style="font-size: 12px; margin: 0;">PikWizard</p>
</a>
</span>
</span>
Free (free of charge)
Free for personal and commercial use.
Author: People Creations
Similar Free Stock Images

Premium

Premium

Premium


Premium


Premium


Premium

Premium


Premium


Premium


Premium

Premium


Premium

Premium


Premium


Premium


Premium


Premium


Premium


Premium


Premium


Premium

Premium


Premium

Premium


Premium


Explore More Free Stock Images