
- Home >
- Stock Photos >
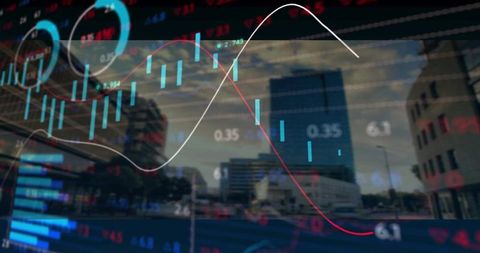
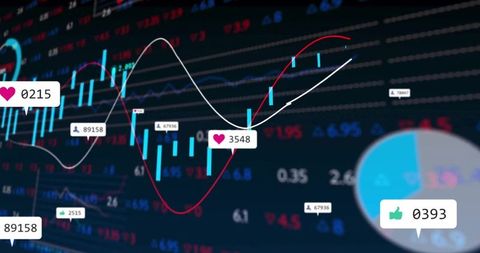
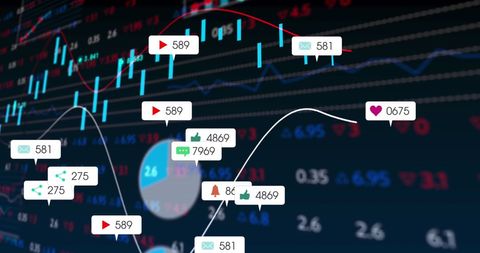
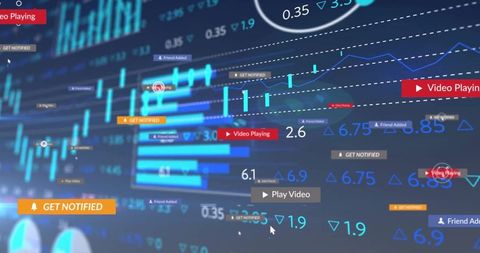
- Animated Countdown with Stock Market Data Visuals
Animated Countdown with Stock Market Data Visuals Image

Visual shows animated countdown in front of dynamic stock market data and graphs on blue background. Ideal for financial sector presentations, technology showcases, and investment strategy storytelling.
Powered by  - Get 15% off with code: PIKWIZARD15


downloads
Tags:
More
Credit Photo
If you would like to credit the Photo, here are some ways you can do so
Text Link
photo Link
<span class="text-link">
<span>
<a target="_blank" href=https://pikwizard.com/photo/animated-countdown-with-stock-market-data-visuals/5fdf89a256dac2e42e5c264d355cfcb0/>PikWizard</a>
</span>
</span>
<span class="image-link">
<span
style="margin: 0 0 20px 0; display: inline-block; vertical-align: middle; width: 100%;"
>
<a
target="_blank"
href="https://pikwizard.com/photo/animated-countdown-with-stock-market-data-visuals/5fdf89a256dac2e42e5c264d355cfcb0/"
style="text-decoration: none; font-size: 10px; margin: 0;"
>
<img src="https://pikwizard.com/pw/medium/5fdf89a256dac2e42e5c264d355cfcb0.jpg" style="margin: 0; width: 100%;" alt="" />
<p style="font-size: 12px; margin: 0;">PikWizard</p>
</a>
</span>
</span>
Free (free of charge)
Free for personal and commercial use.
Author: Awesome Content
Similar Free Stock Images

Premium


Premium


Premium


Premium


Premium

Premium

Premium


Premium

Premium


Premium


Premium

Premium


Premium


Premium


Premium


Premium


Premium


Premium


Premium


Premium


Premium

Premium
Premium


Premium

Premium


Explore More Free Stock Images