
- Home >
- Stock Photos >
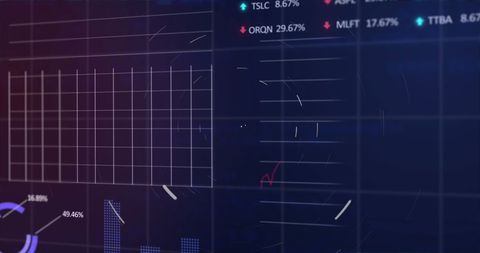
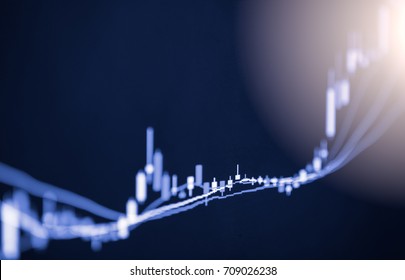
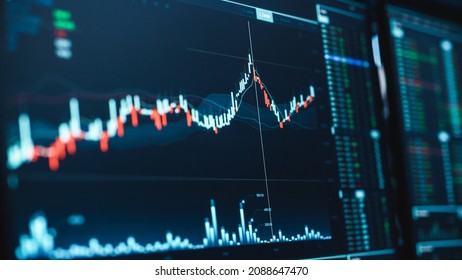
- Animated Financial Graph with Candlestick Chart
Animated Financial Graph with Candlestick Chart Image

Animated financial graph features candlestick chart illuminated against dark digital background, ideal for business, finance, or economic analysis topics. Suitable for illustrating concepts like stock market trends, financial forecasting, or investment strategies.
Powered by  - Get 15% off with code: PIKWIZARD15


2
downloads
downloads
Tags:
More
Credit Photo
If you would like to credit the Photo, here are some ways you can do so
Text Link
photo Link
<span class="text-link">
<span>
<a target="_blank" href=https://pikwizard.com/photo/animated-financial-graph-with-candlestick-chart/878e6f5bd93ae48492a947e74099c2a5/>PikWizard</a>
</span>
</span>
<span class="image-link">
<span
style="margin: 0 0 20px 0; display: inline-block; vertical-align: middle; width: 100%;"
>
<a
target="_blank"
href="https://pikwizard.com/photo/animated-financial-graph-with-candlestick-chart/878e6f5bd93ae48492a947e74099c2a5/"
style="text-decoration: none; font-size: 10px; margin: 0;"
>
<img src="https://pikwizard.com/pw/medium/878e6f5bd93ae48492a947e74099c2a5.jpg" style="margin: 0; width: 100%;" alt="" />
<p style="font-size: 12px; margin: 0;">PikWizard</p>
</a>
</span>
</span>
Free (free of charge)
Free for personal and commercial use.
Author: People Creations
Similar Free Stock Images
Loading...

Premium


Premium

Premium


Premium


Premium


Premium

Premium

Premium


Premium


Premium

Premium


Premium


Premium

Premium


Premium
Premium


Premium


Premium


Premium


Premium

Premium


Premium


Premium


Premium


Premium


