
- Home >
- Stock Photos >
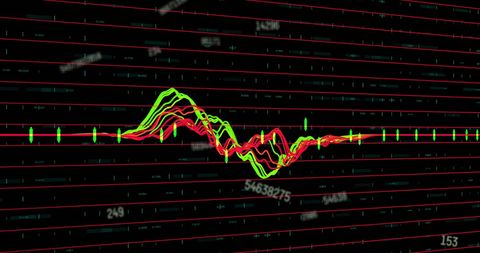
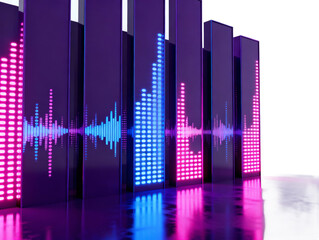
- Animated Waveform and Icons on Digital Interface for Analytics
Animated Waveform and Icons on Digital Interface for Analytics Image
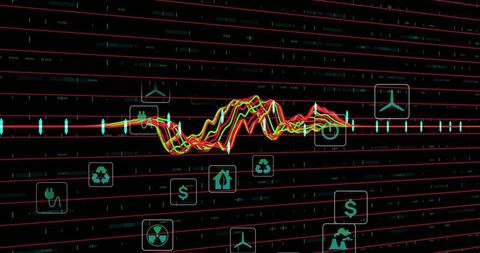
Image highlights modern technological advancement in data analysis and visualization. Vibrant waveform displays various analytics tied with environment and sustainability represented by respective icons. Technological dashboard is ideal for blogs, financial reports, environmental technology sectors, and studies emphasizing data-driven innovations for achieving sustainability goals.
Powered by 


downloads
Tags:
More
Credit Photo
If you would like to credit the Photo, here are some ways you can do so
Text Link
photo Link
<span class="text-link">
<span>
<a target="_blank" href=https://pikwizard.com/photo/animated-waveform-and-icons-on-digital-interface-for-analytics/e2affb8fede26bbe103f84148bea5dcf/>PikWizard</a>
</span>
</span>
<span class="image-link">
<span
style="margin: 0 0 20px 0; display: inline-block; vertical-align: middle; width: 100%;"
>
<a
target="_blank"
href="https://pikwizard.com/photo/animated-waveform-and-icons-on-digital-interface-for-analytics/e2affb8fede26bbe103f84148bea5dcf/"
style="text-decoration: none; font-size: 10px; margin: 0;"
>
<img src="https://pikwizard.com/pw/medium/e2affb8fede26bbe103f84148bea5dcf.jpg" style="margin: 0; width: 100%;" alt="" />
<p style="font-size: 12px; margin: 0;">PikWizard</p>
</a>
</span>
</span>
Free (free of charge)
Free for personal and commercial use.
Author: People Creations
Similar Free Stock Images

Premium


Premium


Premium


Premium


Premium


Premium


Premium

Premium

Premium


Premium


Premium


Premium
Premium


Premium

Premium


Premium


Premium


Premium

Premium
Premium


Premium


Premium


Premium


Premium


Premium

Explore More Free Stock Images