- Home >
- Stock Photos >
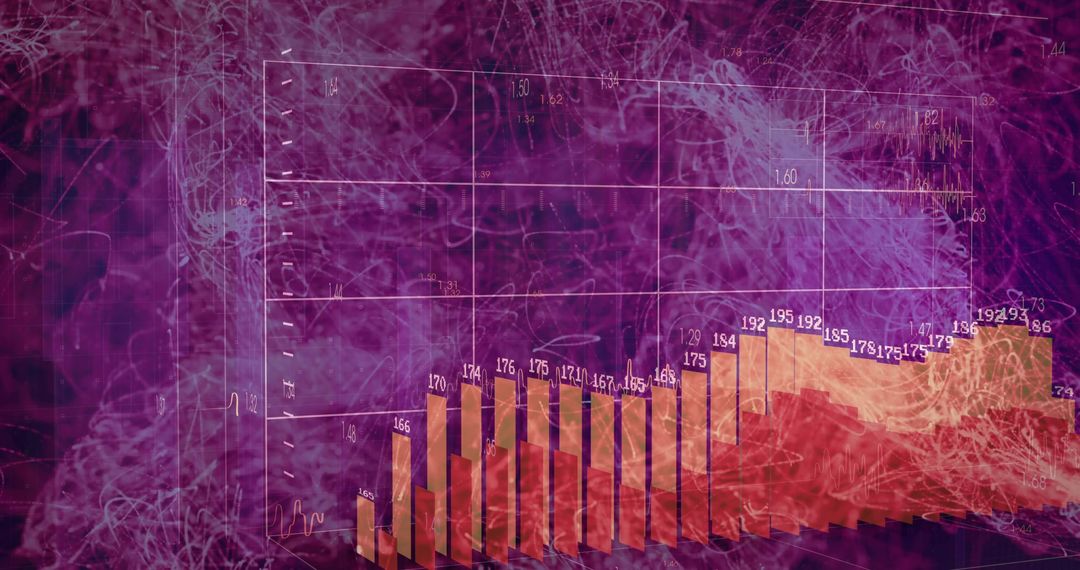
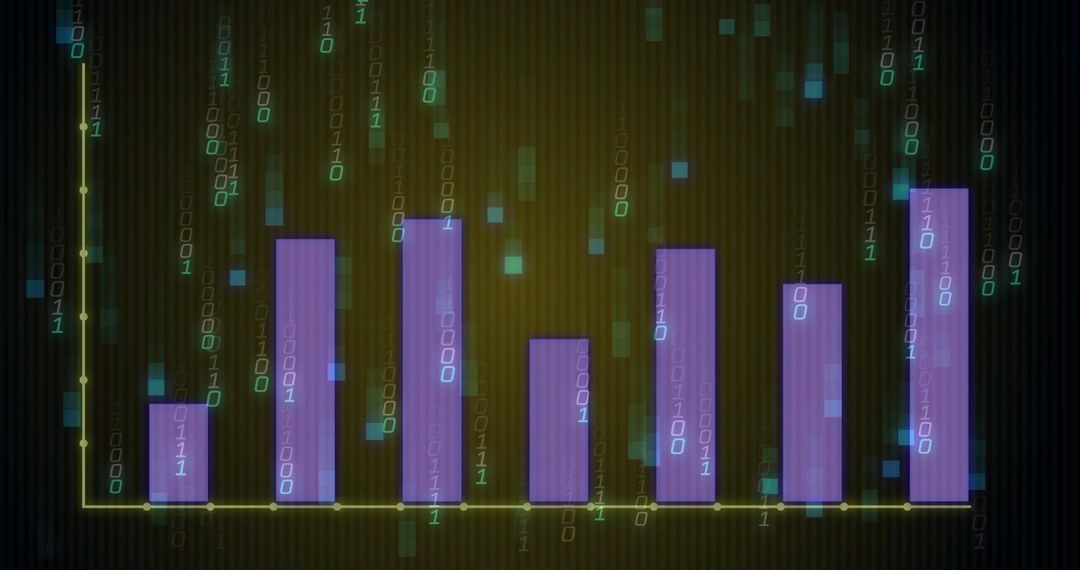
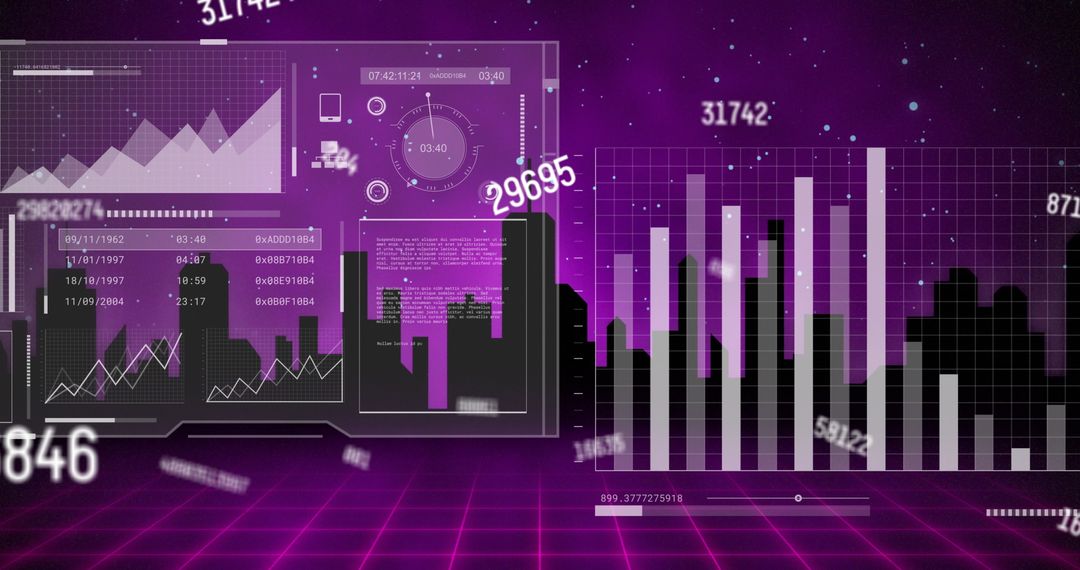
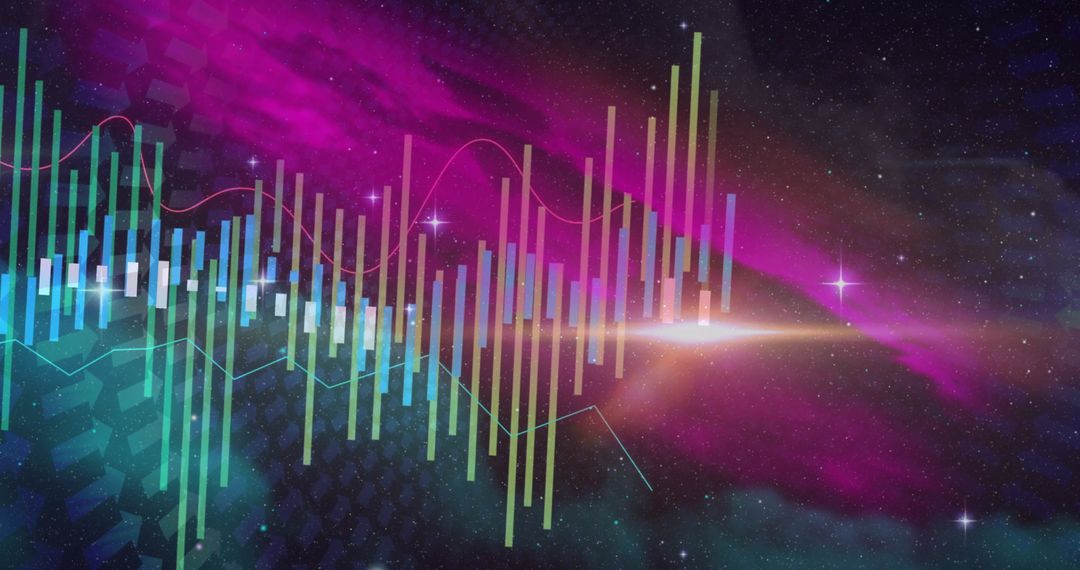
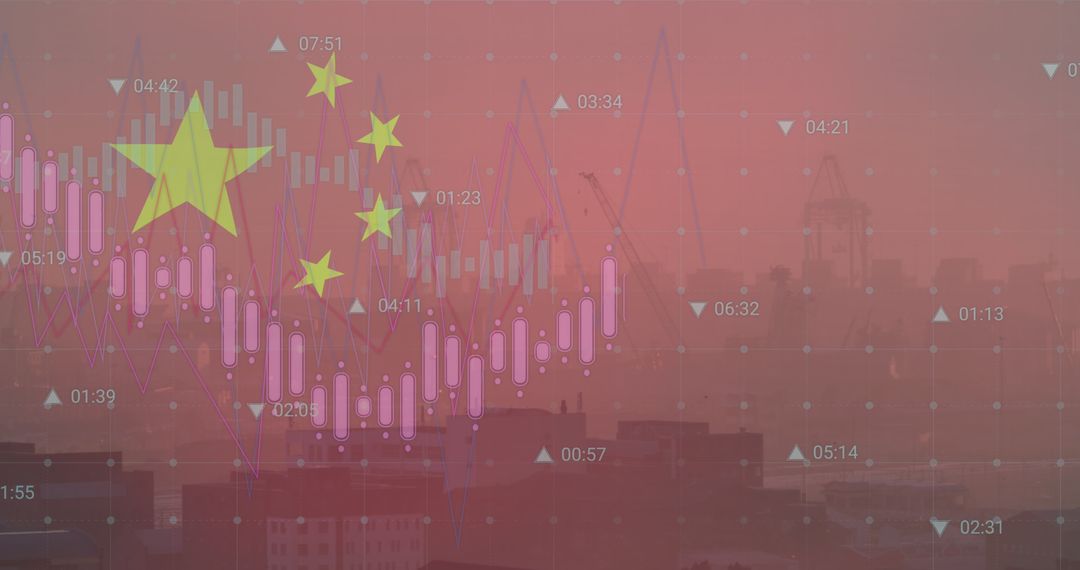
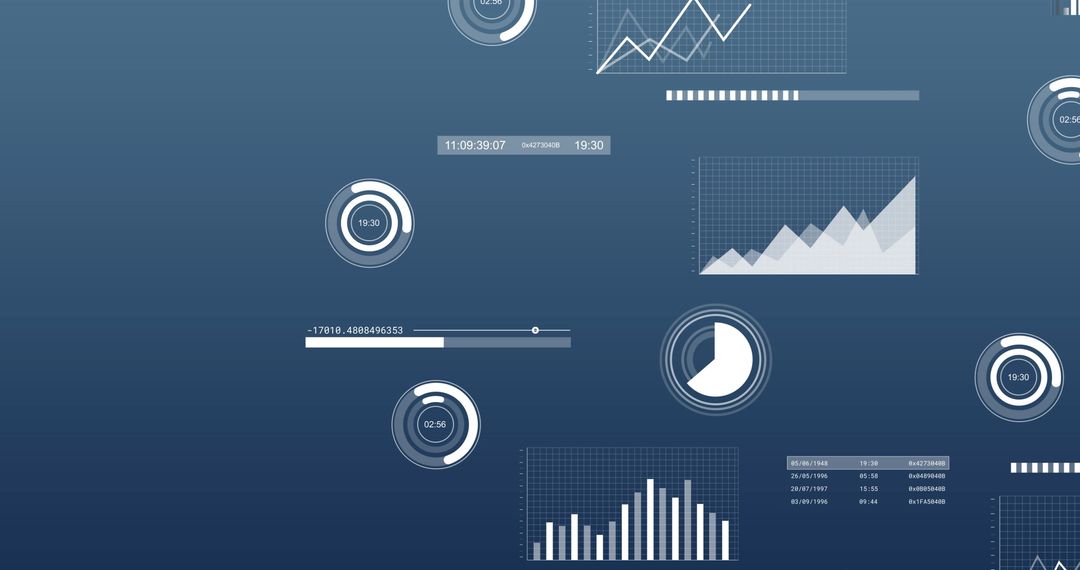
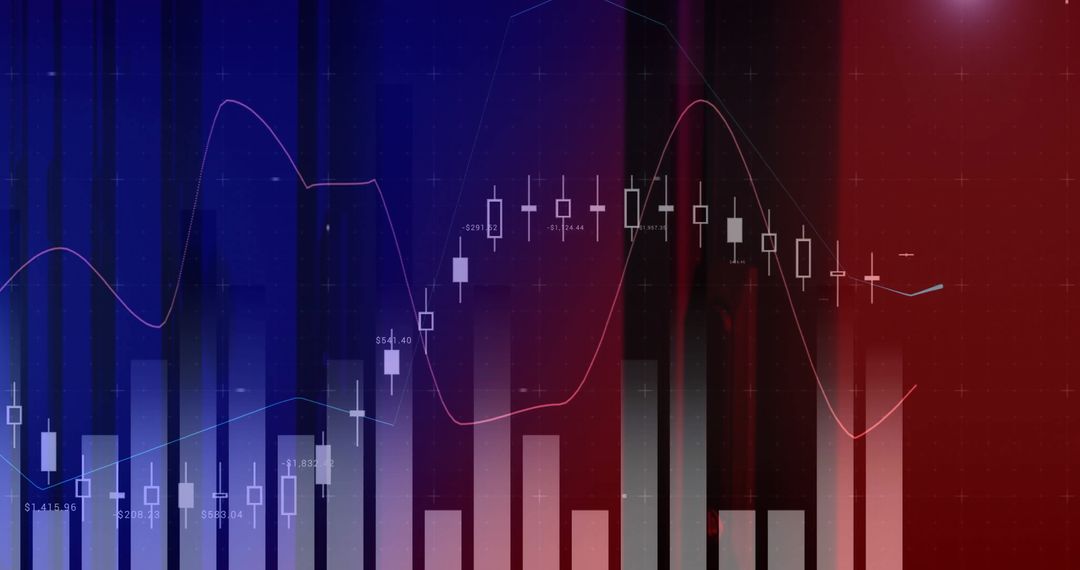
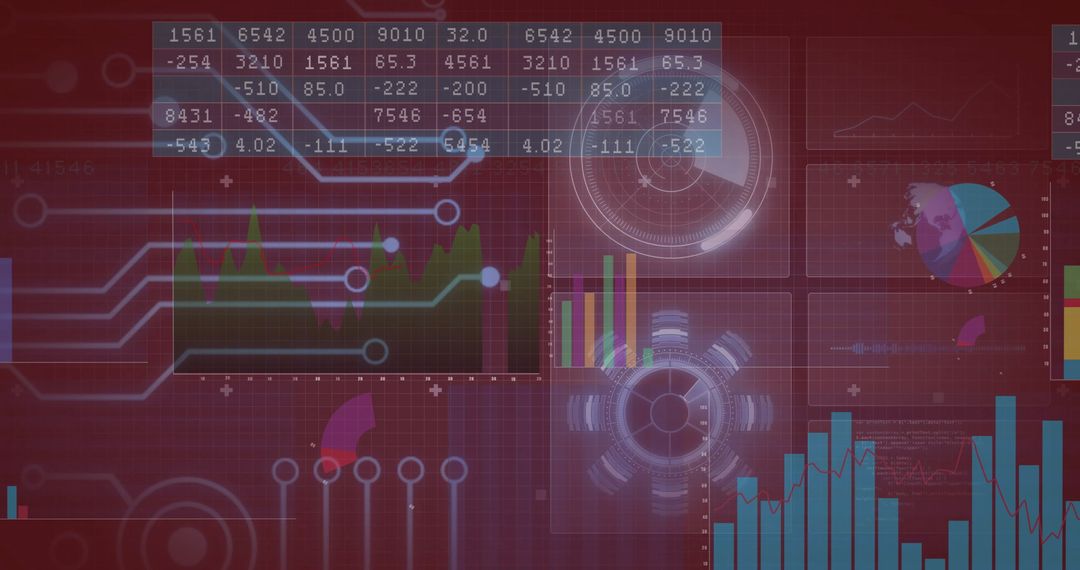
- Animating Neon Data Dashboard with Falling Light Trails, Bar Charts, Numeric Matrix
Animating Neon Data Dashboard with Falling Light Trails, Bar Charts, Numeric Matrix Image
Vibrant neon gradient composition showing numeric matrix overlay, multi-colored bar charts, pie chart segments, and vertical falling light trails. Futuristic digital interface feel combining data visualization and motion to convey analytics, real-time streaming, and financial metrics. Suiting tech websites, fintech presentations, business intelligence reports, marketing banners, UI concept mockups, and conference backdrops. Color palette and dynamic composition helping focus attention on key metrics while adding energetic, modern atmosphere; useful for hero headers, slide decks, social posts, and product landing visuals.
Powered by 


0
downloads
downloads
Tags:
More
Credit Photo
If you would like to credit the Photo, here are some ways you can do so
Text Link
photo Link
<span class="text-link">
<span>
<a target="_blank" href=https://pikwizard.com/photo/animating-neon-data-dashboard-with-falling-light-trails-bar-charts-numeric-matrix/8261337b8b5d92c915366f35f241c4ec/>PikWizard</a>
</span>
</span>
<span class="image-link">
<span
style="margin: 0 0 20px 0; display: inline-block; vertical-align: middle; width: 100%;"
>
<a
target="_blank"
href="https://pikwizard.com/photo/animating-neon-data-dashboard-with-falling-light-trails-bar-charts-numeric-matrix/8261337b8b5d92c915366f35f241c4ec/"
style="text-decoration: none; font-size: 10px; margin: 0;"
>
<img src="https://pikwizard.com/pw/medium/8261337b8b5d92c915366f35f241c4ec.jpg" style="margin: 0; width: 100%;" alt="" />
<p style="font-size: 12px; margin: 0;">PikWizard</p>
</a>
</span>
</span>
Free (free of charge)
Free for personal and commercial use.
Author: People Creations
Similar Free Stock Images

Premium


Premium


Premium


Premium


Premium


Premium


Premium


Premium


Premium


Premium


Premium


Premium


Premium


Premium


Premium


Premium


Premium


Premium


Premium


Premium


Premium


Premium


Premium


Premium