- Home >
- Stock Photos >
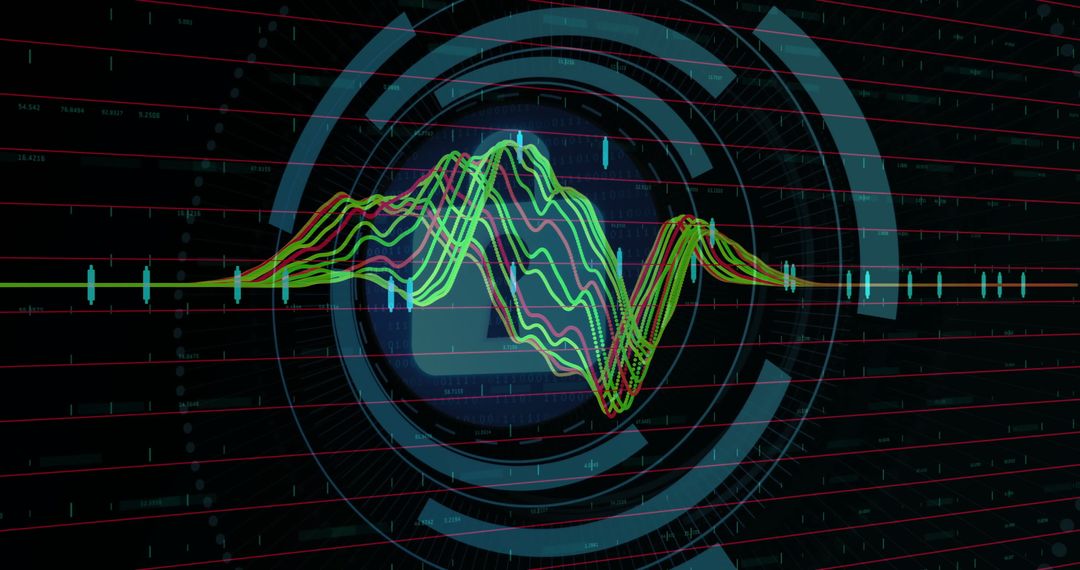
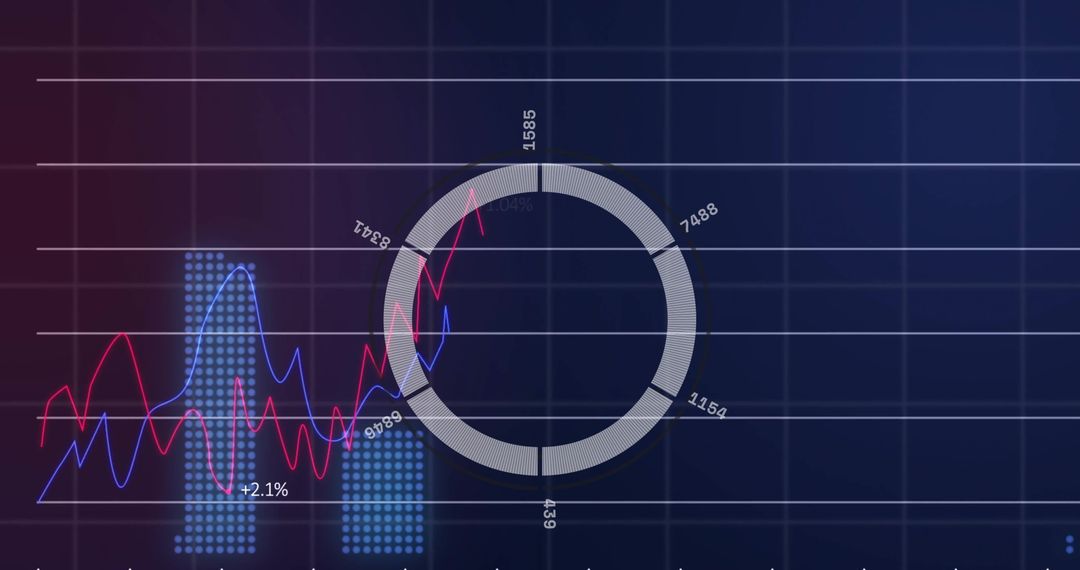
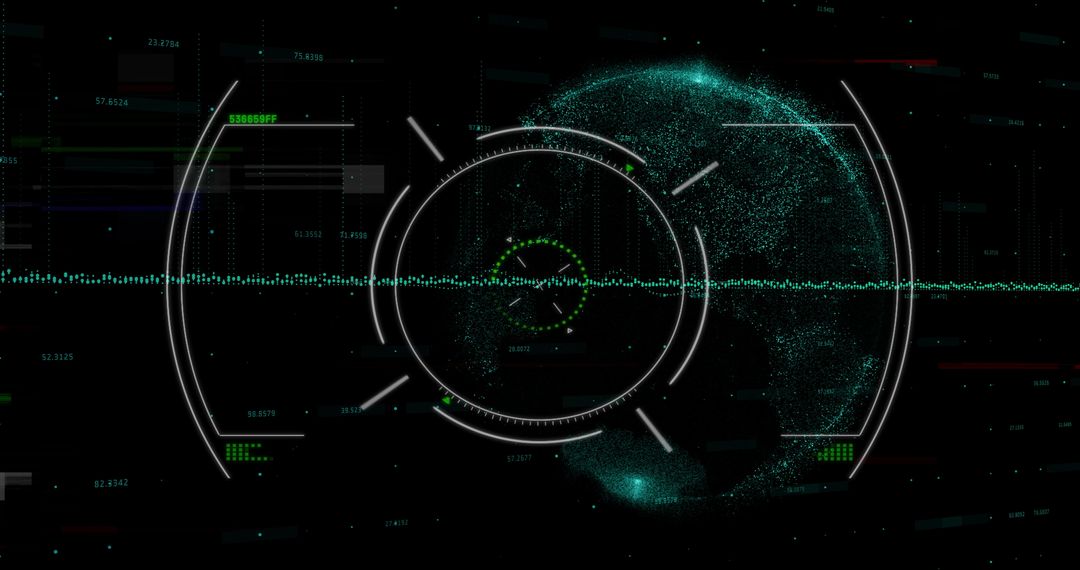
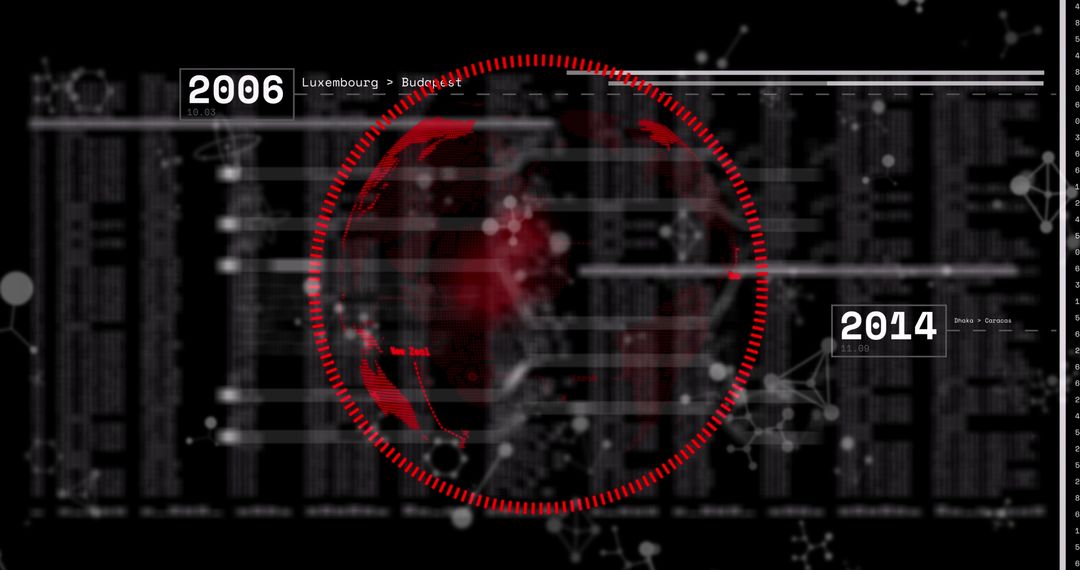
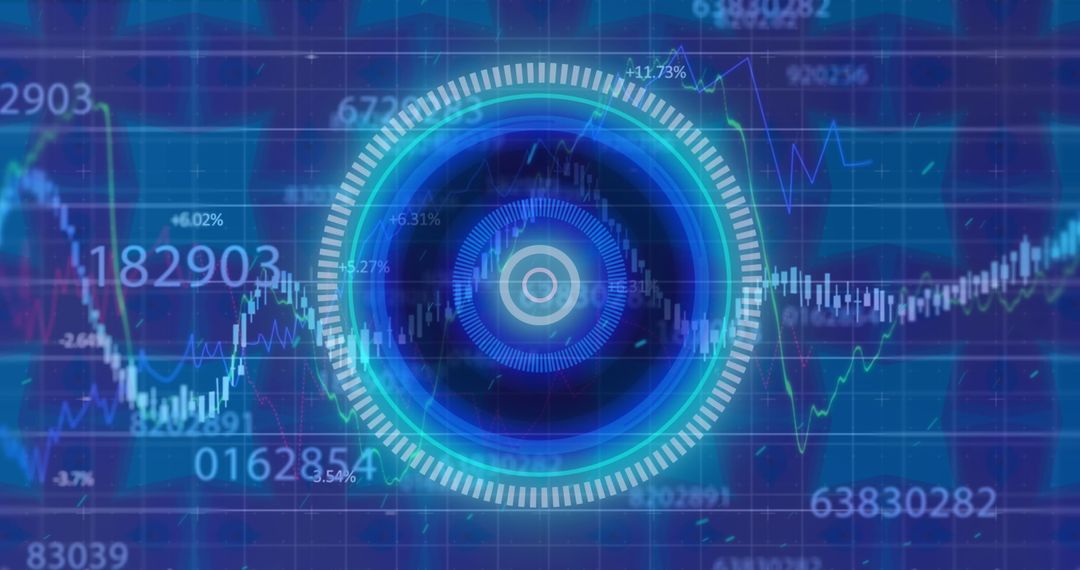
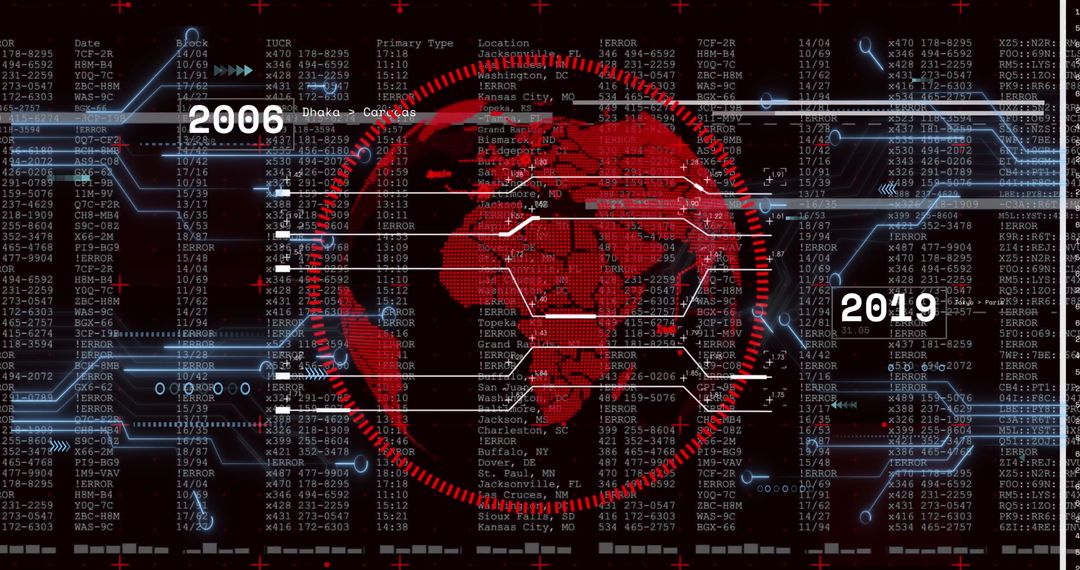
- Animating red radar gauge centering holographic data dashboard with 2009 and 2019 timelines
Animating red radar gauge centering holographic data dashboard with 2009 and 2019 timelines Image
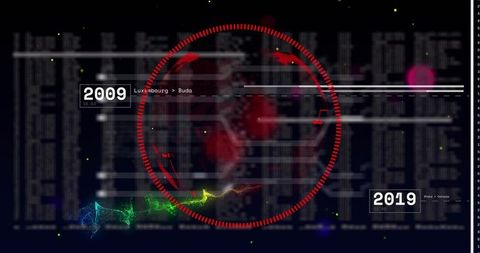
Showing red circular radar gauge centering on dark holographic dashboard with blurred columns of data and timeline markers for 2009 and 2019. Neon waveform and multicolor particle trails adding dynamic high-tech atmosphere. Suitable for technology presentations, cybersecurity reports, data analytics dashboards, startup pitch decks, motion design reels, website hero banners. Use for background in infographic overlays, video title sequences, UI concept mockups, marketing materials for analytics tools, corporate annual reports. Color palette and composition working well with animated transitions, lower third graphics, headline typography, and split-screen layouts.
Powered by  - Get 15% off with code: PIKWIZARD15

0
downloads
downloads
Tags:
More
Credit Photo
If you would like to credit the Photo, here are some ways you can do so
Text Link
photo Link
<span class="text-link">
<span>
<a target="_blank" href=https://pikwizard.com/photo/animating-red-radar-gauge-centering-holographic-data-dashboard-with-2009-and-2019-timelines/fa0950c77458c3205e0831dc92dcb576/>PikWizard</a>
</span>
</span>
<span class="image-link">
<span
style="margin: 0 0 20px 0; display: inline-block; vertical-align: middle; width: 100%;"
>
<a
target="_blank"
href="https://pikwizard.com/photo/animating-red-radar-gauge-centering-holographic-data-dashboard-with-2009-and-2019-timelines/fa0950c77458c3205e0831dc92dcb576/"
style="text-decoration: none; font-size: 10px; margin: 0;"
>
<img src="https://pikwizard.com/pw/medium/fa0950c77458c3205e0831dc92dcb576.jpg" style="margin: 0; width: 100%;" alt="" />
<p style="font-size: 12px; margin: 0;">PikWizard</p>
</a>
</span>
</span>
Free (free of charge)
Free for personal and commercial use.
Author: Creative Art
Similar Free Stock Images