
- Home >
- Stock Photos >
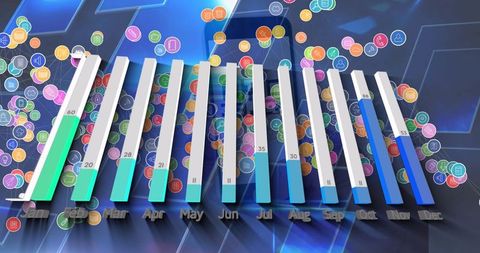
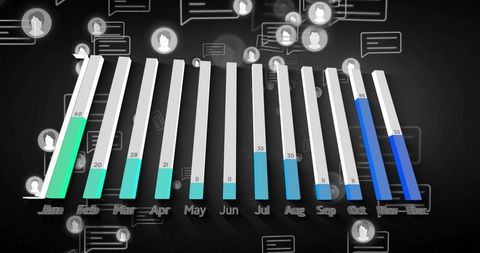
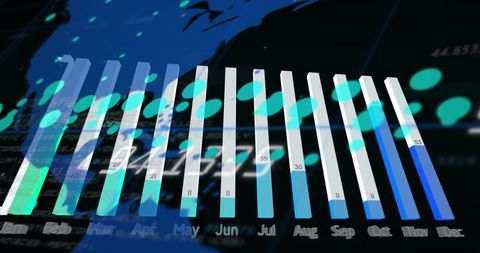
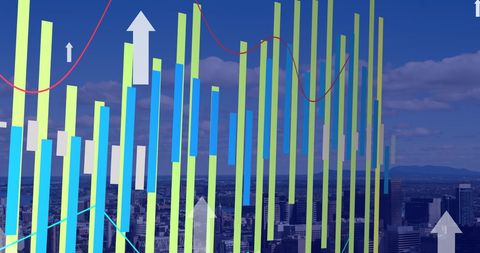
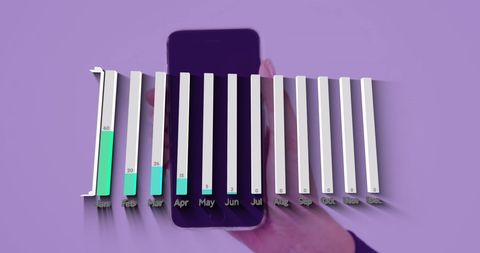
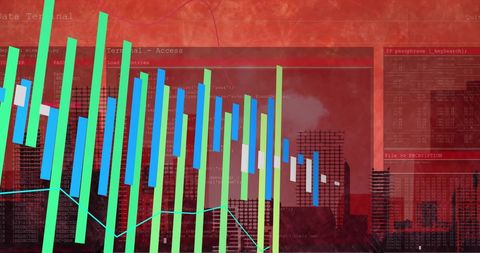
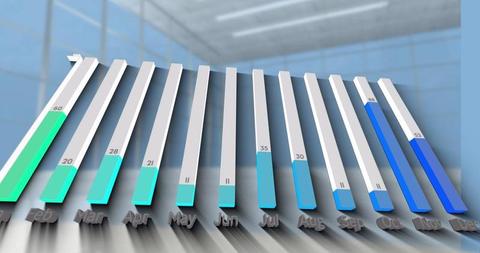
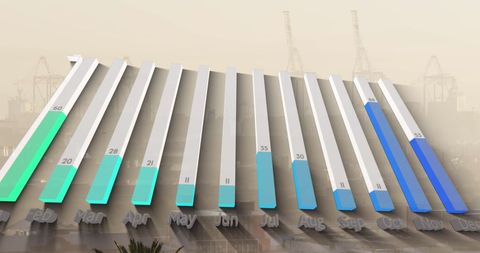
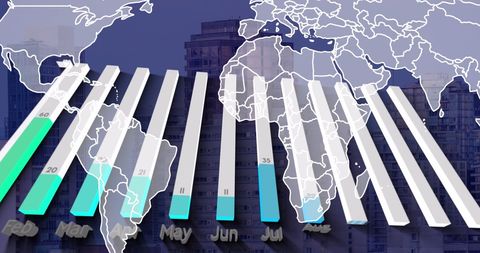
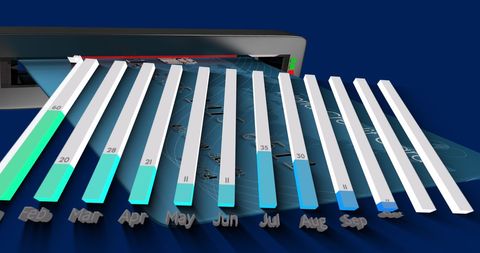
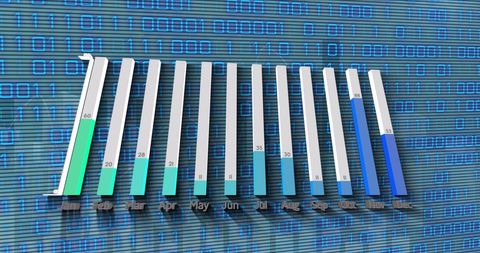
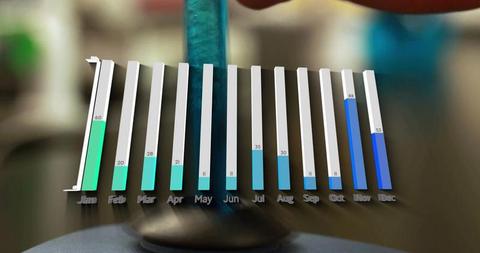
- Annual Data Processing Graph on Colorful Digital Background
Annual Data Processing Graph on Colorful Digital Background Image

Illustrates an annual overview of data processing with a vibrant digital scene. Each month displays distinctive bar length, offering clarity in monthly performance metrics. Useful for technology and business presentations, conveying analytics and digital communication concepts.
Powered by 


downloads
Tags:
More
Credit Photo
If you would like to credit the Photo, here are some ways you can do so
Text Link
photo Link
<span class="text-link">
<span>
<a target="_blank" href=https://pikwizard.com/photo/annual-data-processing-graph-on-colorful-digital-background/fe8b8602028d84bc83b1fe33aaccf242/>PikWizard</a>
</span>
</span>
<span class="image-link">
<span
style="margin: 0 0 20px 0; display: inline-block; vertical-align: middle; width: 100%;"
>
<a
target="_blank"
href="https://pikwizard.com/photo/annual-data-processing-graph-on-colorful-digital-background/fe8b8602028d84bc83b1fe33aaccf242/"
style="text-decoration: none; font-size: 10px; margin: 0;"
>
<img src="https://pikwizard.com/pw/medium/fe8b8602028d84bc83b1fe33aaccf242.jpg" style="margin: 0; width: 100%;" alt="" />
<p style="font-size: 12px; margin: 0;">PikWizard</p>
</a>
</span>
</span>
Free (free of charge)
Free for personal and commercial use.
Author: People Creations
Similar Free Stock Images
Premium

Premium

Premium


Premium

Premium

Premium


Premium

Premium


Premium

Premium

Premium


Premium


Premium


Premium


Premium


Premium


Premium

Premium

Premium

Premium


Premium

Premium

Premium


Explore More Free Stock Images