1. Home > 
  2. Stock Photos > 
  3. Annual Financial Data Chart Over Cityscape Background

Annual Financial Data Chart Over Cityscape Background Image

Annual Financial Data Chart Over Cityscape Background

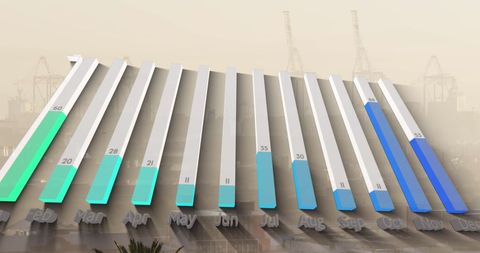
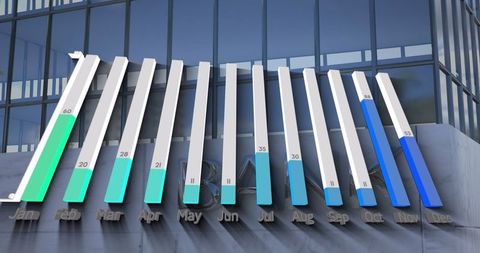
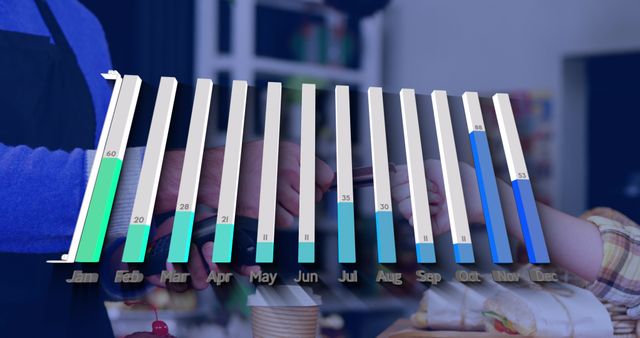
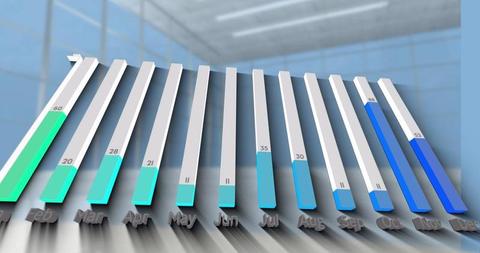
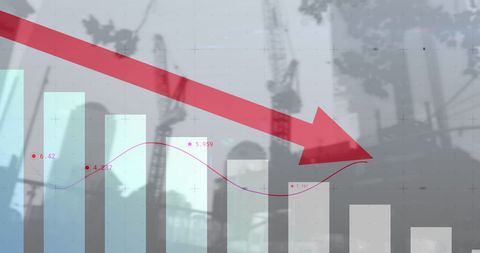
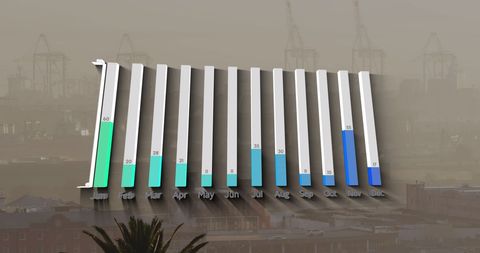
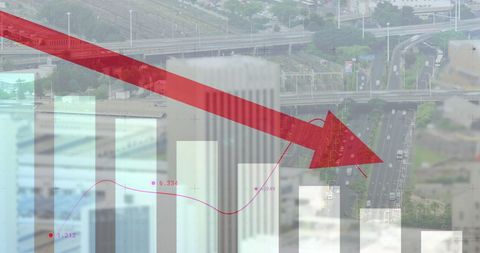
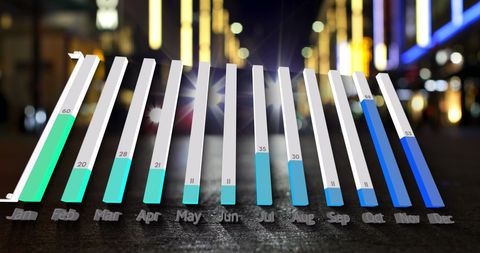
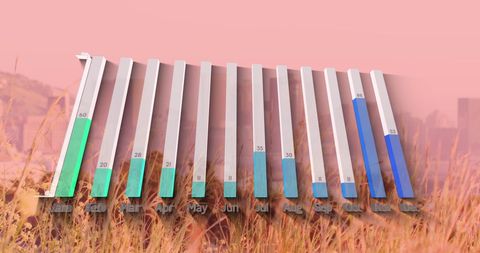
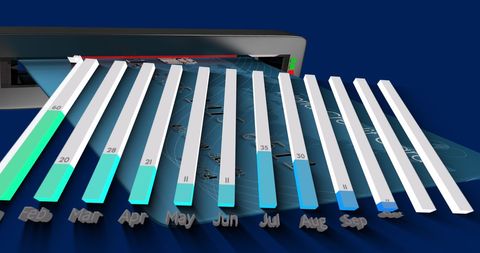
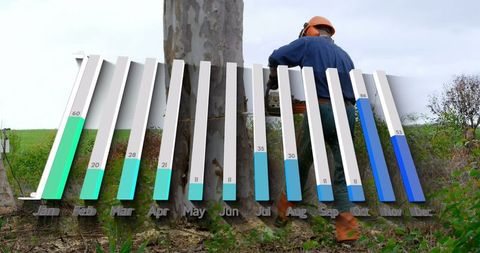
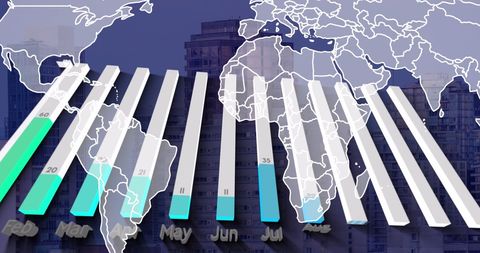
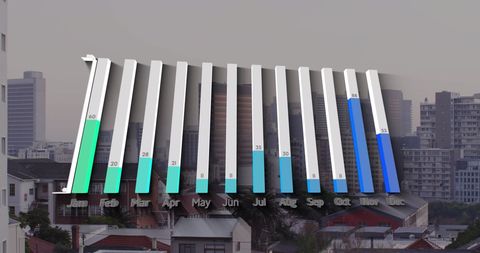
Monthly bar chart with urban background illustrates financial trends over the year. Blue and green hues emphasize key data points. Useful for presentations, economic analyses, and illustrating business or financial progress related to urban development and corporate performance.

Powered by Shutterstock logo - Get 15% off with code: PIKWIZARD15
Business and Finance investment. World economic growth. Forex candlestick graph hologram and financial graph chart, market report on night cityscape for internet trading, brokerage, analysis concept. - Powered by Shutterstock - Get 15% off with code: PIKWIZARD15Showing data displays overlaying city skyline in downtown district, featuring skyscraper clusters. Urban, financial, analytics, modernization, data visualization, commercial, cityscape - Powered by Shutterstock - Get 15% off with code: PIKWIZARD15New York city skyscraper downtown panoramic view. Financial chart with graph, bar diagram and lines in the foreground. Concept of trading on stock market in megapolis - Powered by Shutterstock - Get 15% off with code: PIKWIZARD15Overlaying financial data on downtown skyline, with bar charts, line graphs, and numeric labels. Urban, finance, analytics, technology, business, data, skyscrapers - Powered by Shutterstock - Get 15% off with code: PIKWIZARD15Showing financial data overlaying night skyline with bars and candlesticks, labels, moving averages. Finance, data visualization, urban, modern, technology, analytics, digital - Powered by Shutterstock - Get 15% off with code: PIKWIZARD15

Credit Photo

If you would like to credit the Photo, here are some ways you can do so

Free (free of charge)

Free for personal and commercial use.

Author: Creative Art

Similar Free Stock Images

Futuristic Digital Bar Graph Over Earth Illustrating Global Data Trends
Premium
Skyscrapers Cityscape Downtown View, Chicago Skyline Buildings. Beautiful Real Estate. Night time. Forex Financial graph and chart hologram. Business education concept.
Premium
Big data chart on city backdrop.Trade technology, and investment analysis.Business development, financial plan and strategy.Analysis finance graph and market chart investment.
Rising Blue Arrow with Bar Chart in Urban Background
Sustainable Energy Data Analysis Over Wind Turbine Background
3D Bar Graph Displaying Data Across Months on Dark Background
Digital Data Processing Visualization over Eiffel Tower Scene
Premium
Overlaying candlestick bars and line graphs on city skyline, with skyscrapers and elevated highway. Urban, finance, digital, data visualization, architecture, growth, technology
Digital Graph Increase with Blue Background
Financial Growth Analysis Displayed on Bar Chart
Futuristic Digital Bar Graph with Holographic Interface
Premium
Financial charts with various data points overlaying a cityscape featuring tall skyscrapers. Clear sky background. Concept of urban finance
Premium
Growth property price and business development concept with digital graphic financial chart graphs and stats data on city skyline background at sunset, double exposure
Rising Bar Graph with Cityscape Background Symbolizing Business Growth
3D Bar Graphs over World Map Showcasing Data Trends
Digital Business Data Graph with Rising Arrow Overlay
Digital Financial Data Visualization on Cityscape
Premium
Image of multiple graphs, map and loading bars over aerial view of modern buildings against sky. Digital composite, multiple exposure, report, business, progress, global and architecture concept.
Seasonal Data Trends with Sustainable Energy Focus
Declining Global Market Trends Over Urban Skyline
Social Media Analytics Over City Landscape
3D Bar Graph with Skyscraper Background Illustrating Business Analytics
Premium
Technical stock  bar chart  and  Exchange Building in city Thailand.
Global Business Decline and Economic Downturn Concept
Futuristic Data Visualization with Timeline and Graph
Financial Decline Indicated by Decreasing Market Trends
Futuristic Data Visualization with Bar Graph Overlay
Premium
Overlaying financial charts on city skyline, showing candlesticks, line graphs and numeric data. Urban, finance, technology, analytics, corporate, modern, data
Digital Countdown Overlay on Cityscape for Business Usage
Abstract Financial Chart with Declining Red Arrow Over Cityscape
Growing Line and Bar Graph over World Map Concept
3D Monthly Financial Bar Graph Against Binary Data Background
Digital Data Processing Graph Over Blue Background
Digital Representation of Business Data Analytics on Server Background
City Night Lights with Digital Data Overlay Chart
Digital Business Growth Chart Overlaying Payment Scene
Premium
Displaying finance chart floating over downtown, with candlestick bars, line graph and UI labels. Financial, urban, data, technology, analytics, innovation, business
Premium
A forex trading chart featuring colorful candlesticks and lines over the LA cityscape, clear sky. Concept of finance and urban growth
3D Bar Chart with Subscribe Text on Navy Background
Dynamic Financial Data Represented in Vertical Bars on Purple Background
Upward Trend Arrow with Blue Digital Graph Over Landscape
Rising Business Growth and Analytics Visualization
Digital Data Processing and Global Technology Interface
Futuristic Financial and Data Analysis Background
Bar Graph Visualization with Stock Market Data Background
Futuristic Digital Bar Graph with Monthly Data on Technology Interface
Premium
Skyscrapers Cityscape Downtown View, Chicago Skyline Buildings. Beautiful Real Estate. Sunset. Forex Financial graph and chart hologram. Business education concept.
Premium
Displaying digital financial bars and trend lines over dusk skyline, with dollar labels plus nodes. Financial analysis, data visualization, urban design, modern technology, investment, economic
Quarterly Data Trends Overlaid on Modern Server Room
Digital Infographic on Global Data Over Planet Earth
Glitch Effect on Declining Finance Graph with Red Arrow
Colorful Bar Chart Over Digital Stock Market Background
Futuristic 3D Bar Graphs Depicting Data Trends over a Digital Blue Background
Data Bar Chart Digital Overlay on Cityscape Background
Innovative 3D Graph Display for Business Analytics
Data Analysis with DNA Visualization on Digital Interface
Premium
Summer day time cityscape of Philadelphia financial downtown, Pennsylvania, USA. City Hall. Glowing forex candlesticks and bar graph hologram. The concept of internet trading, brokerage and analysis
Premium
Displaying translucent financial chart overlay in city skyline at dusk with candlestick bars. Analytics, finance, urban, data visualization, technology, modern, investment
3D Bar Chart Displaying Monthly Warehouse Data
Collaborative Business Teamwith Digital Data Overlay
Digital Interface Overlaying City Buildings with Rising Graphs
Business Charts Showing Declining Financial Trends
Premium
Summer day time cityscape of Philadelphia financial downtown, Pennsylvania, USA. City Hall. Glowing forex candlesticks and bar graph hologram. The concept of internet trading, brokerage and analysis
Futuristic Data Visualizations Merging with Landscape
3D Bar Graph on Digital Binary Background, Financial Data Concept
Diverse Students Using Computers with Financial Graph Overlay
Logger Cutting Tree with 3D Bar Chart Analysis Overlay
Digital Data Analytics Over Virtual Graphics Background
Bar Graph with Downward Red Arrow Indicating Economic Decline
Growing Financial Trend Chart
Dynamic Graphs and Binary Code on Digital Interface
Futuristic Enhanced Bar Chart Displaying Monthly Data Trends
3D Bar Graph Showcasing Monthly Digit Performance in Modern Office
Financial Graphs Overlay on Cityscape Illustrating Global Market Trends
Futuristic Financial Data Visualization on Urban Skyline
Annual Data Visualization on Navy Background
Futuristic Graphs with Man in VR Headset Conceptualizing Security
Premium
Displaying semi-transparent bar chart and line graph overlaying city road, grid lines and towers. Digital analytics, urban visualization, data presentation, financial growth, modern architecture,
Digital Financial Data with Rising Chart Visualization
Financial Analysis and DNA Strand Integration Concept
Digital Bar Chart Data Visualization on Blue Background
3D Bar Graph Displaying Monthly Business Data Analysis
Premium
Abstract financial chart bars and graphs over USA cityscape background with modern buildings and waterfront, concept of stock market and economy
Monthly Data Bar Chart Visualization with Infographic Design Elements
Abstract Financial Graphs with Glowing Light Trails
3D Bar Chart Displaying Monthly Data with Digital Interface Icons
Dynamic Infographic Highlighting Monthly Data Trends with Activity Icons
Premium
Summer day time cityscape of Philadelphia financial downtown, Pennsylvania, USA. City Hall. Glowing forex candlesticks and bar graph hologram. The concept of internet trading, brokerage and analysis
Digital 3D Bar Graph Overlays Circuit Board Background
Power Lines and Data Graphics Symbolize Energy Progress
Futuristic Data Visualization Graph with Technological Elements
3D Financial Data Chart on Futuristic Purple Background
Premium
Panorama cityscape view of San Francisco financial downtown from rooftop, day time, California, US. Forex graph hologram. The concept of internet trading, brokerage and fundamental analysis, charts
Premium
Displaying reflective glass towers ascending in business district, with frosted bar chart overlay. Skyscrapers, urban, finance, corporate, modern, architecture, progress
Digital Data Analytics and Global Business Interface
Low Angle View of Modern Architectural Structure under Clear Sky
Digital Data Overlay on Green Landscape Reflecting Global Business Tech
Premium
City skyline displaying financial overlays in cityscape, with candlestick charts and numeric labels. Metropolitan, skyline, data visualization, urban, financial analysis, technology, corporate
Dynamic Financial Graph and Data Visualization in Digital Space
Financial Growth Concept with Data Charts and Arrow Overlay
Modern Bar Graph Visualization with Monthly Data on Dark Background
Interactive 3D Business Data Chart with Connectivity Network
Premium
Manhattan skyline with digital stock charts and bar graphs overlayed, modern graphic style, blue background, concept of finance and economy
Premium
Multi exposure of abstract virtual graphic data spreadsheet sketch on Los Angeles cityscape background, analytics and analysis concept
Declining Financial Trends Affecting Construction Industry
Monthly Statistical Data Visualization with Bank Background
Digital Financial Data Visualization with Binary Code
Global Business Finance and Technology Abstract Concept
Global Finance Growth with Dynamic Arrow and Data Chart
Digital Statistics Analysis with Declining Red Arrow
Futuristic Digital Monthly Bar Graph with Green Background and Glowing Globe
Annual Data Trend Chart Overlaid on Urban Background
Upward Arrow with Graphs Symbolizing Business Growth
Premium
Skyscrapers Cityscape Downtown View, Chicago Skyline Buildings. Beautiful Real Estate. Day time. Forex Financial graph and chart hologram. Business education concept.
Premium
Displaying trading dashboard overlaying blurred city lights, with bar charts line graphs and tables. Technology, analytics, data visualization, finance, digital, urban, abstract
Futuristic Digital Graph with Data Visualization Elements
Renewable Energy Graphic Overlay on Wind Turbine Scenery
Futuristic Data Analytics with 3D Histogram
Global Market Decline Over Urban Cityscape Background
Financial Graphs and Cityscape, Digital Data Analytics Concept
Rising Business Graph Overlay on Blue Sky Background
Digital Data Visualization Overlapping Modern Cityscape
Financial Data Graphs Overlaid on Ukrainian Flag Visual
Abstract Digital Bar Chart on Dimensional Background
Annual Data Processing Graph on Colorful Digital Background
Explore More Free Stock Images