- Home >
- Stock Photos >
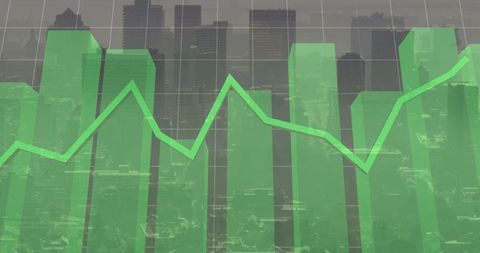
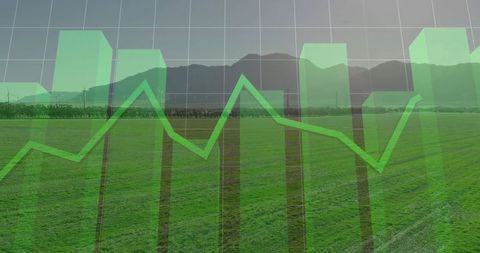
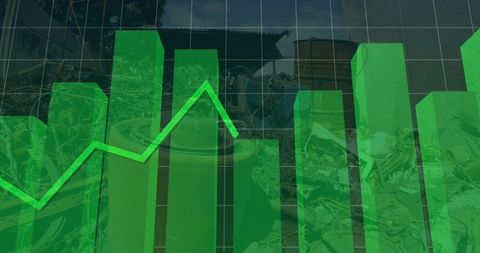
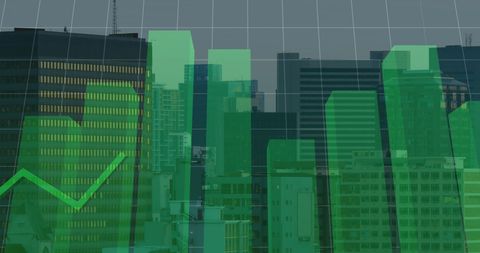
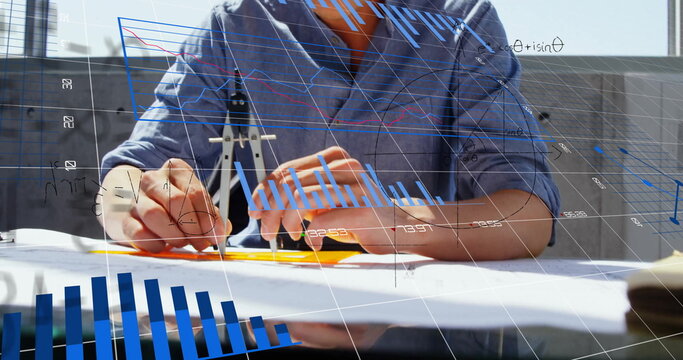
- Architect Analyzing Financial Data with Mathematical Technology Overlay
Architect Analyzing Financial Data with Mathematical Technology Overlay Image
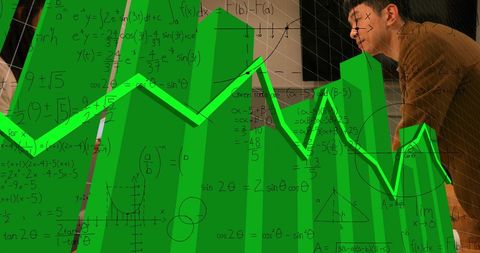
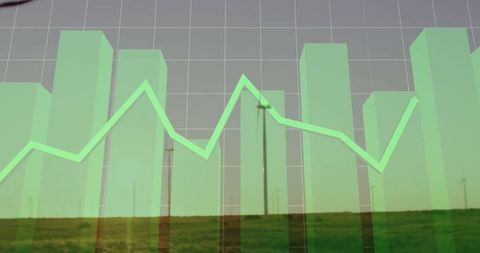
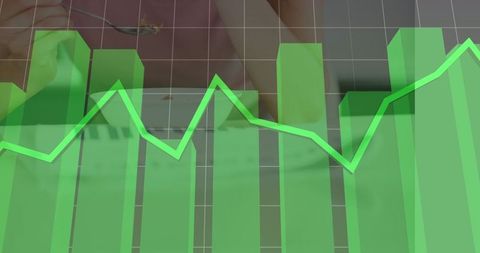
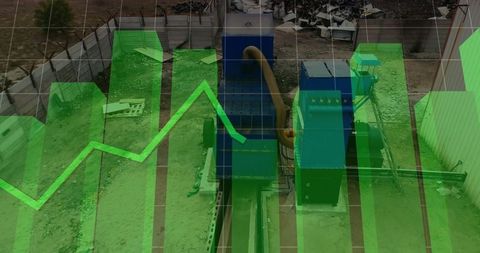
Visually depicting the intersection of architecture and finance, this image conveys a concept of an architect engaged with intricate financial data and mathematical equations. Ideal for use in projects related to global finance, business technology, academic studies in data analysis, and advancements in architectural technology illustrating complex digital transformations.
Powered by 

downloads
Tags:
More
Credit Photo
If you would like to credit the Photo, here are some ways you can do so
Text Link
photo Link
<span class="text-link">
<span>
<a target="_blank" href=https://pikwizard.com/photo/architect-analyzing-financial-data-with-mathematical-technology-overlay/91e9cb59d30d5f2feee6031617d2face/>PikWizard</a>
</span>
</span>
<span class="image-link">
<span
style="margin: 0 0 20px 0; display: inline-block; vertical-align: middle; width: 100%;"
>
<a
target="_blank"
href="https://pikwizard.com/photo/architect-analyzing-financial-data-with-mathematical-technology-overlay/91e9cb59d30d5f2feee6031617d2face/"
style="text-decoration: none; font-size: 10px; margin: 0;"
>
<img src="https://pikwizard.com/pw/medium/91e9cb59d30d5f2feee6031617d2face.jpg" style="margin: 0; width: 100%;" alt="" />
<p style="font-size: 12px; margin: 0;">PikWizard</p>
</a>
</span>
</span>
Free (free of charge)
Free for personal and commercial use.
Author: Awesome Content