- Home >
- Stock Photos >
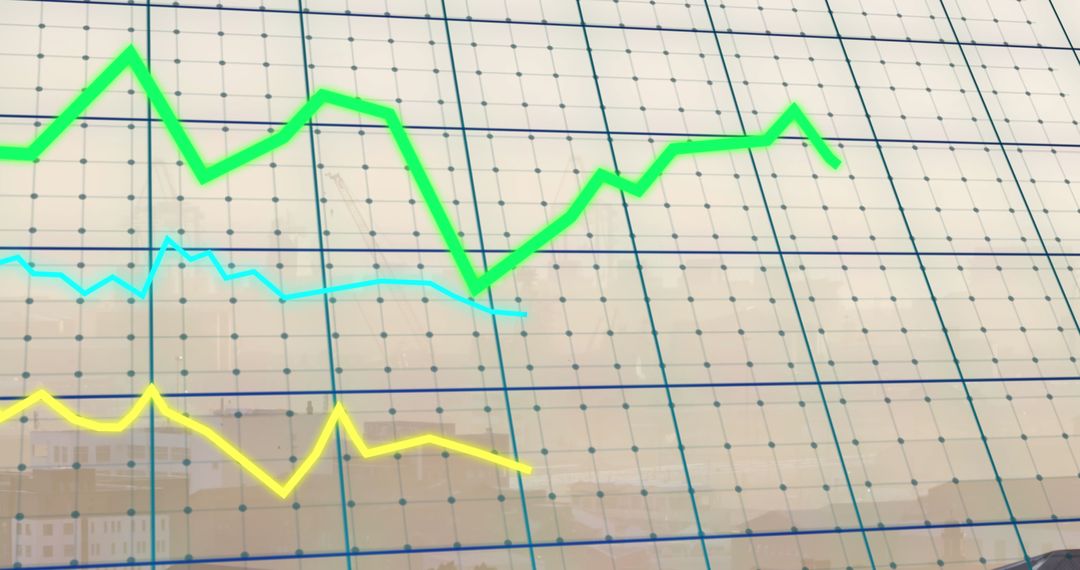
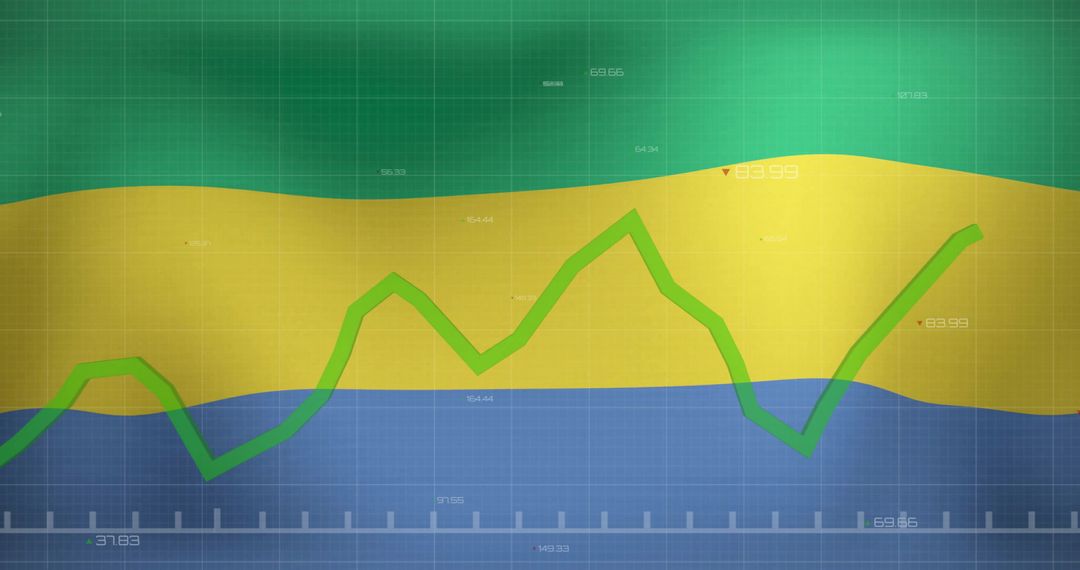
- Armenian Flag with Financial Graph Overlay Depicting Market Trends
Armenian Flag with Financial Graph Overlay Depicting Market Trends Image

Abstract representation intertwining Armenian identity with financial market trends. Vibrant lines on financial graphs overlay national flag, symbolizing economic analysis and trend forecasting. Use for illustrating economy-related matters within Armenia or contextual modeling in global finance reports focusing on individual country scales.
Powered by  - Get 15% off with code: PIKWIZARD15


2
downloads
downloads
Tags:
More
Credit Photo
If you would like to credit the Photo, here are some ways you can do so
Text Link
photo Link
<span class="text-link">
<span>
<a target="_blank" href=https://pikwizard.com/photo/armenian-flag-with-financial-graph-overlay-depicting-market-trends/3e674f53204f2e6665f1d7c3b9e3ba87/>PikWizard</a>
</span>
</span>
<span class="image-link">
<span
style="margin: 0 0 20px 0; display: inline-block; vertical-align: middle; width: 100%;"
>
<a
target="_blank"
href="https://pikwizard.com/photo/armenian-flag-with-financial-graph-overlay-depicting-market-trends/3e674f53204f2e6665f1d7c3b9e3ba87/"
style="text-decoration: none; font-size: 10px; margin: 0;"
>
<img src="https://pikwizard.com/pw/medium/3e674f53204f2e6665f1d7c3b9e3ba87.jpg" style="margin: 0; width: 100%;" alt="" />
<p style="font-size: 12px; margin: 0;">PikWizard</p>
</a>
</span>
</span>
Free (free of charge)
Free for personal and commercial use.
Author: People Creations
Similar Free Stock Images

Premium


Premium


Premium


Premium


Premium


Premium


Premium