
- Home >
- Stock Photos >
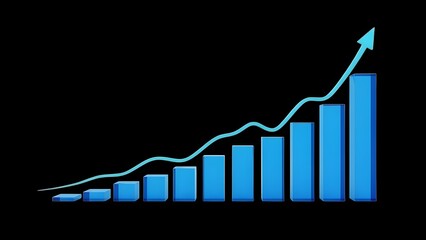
- Ascending Graph Lines on Data Dashboard Visual Spreadsheet
Ascending Graph Lines on Data Dashboard Visual Spreadsheet Image

This image illustrates ascending trend lines on a modern data dashboard, conveying growth or progression. It's ideal for use in contexts involving business analysis, financial forecasts, or technology and stock analysis, as it visually communicates data trends.
Powered by 


downloads
Tags:
More
Credit Photo
If you would like to credit the Photo, here are some ways you can do so
Text Link
photo Link
<span class="text-link">
<span>
<a target="_blank" href=https://pikwizard.com/photo/ascending-graph-lines-on-data-dashboard-visual-spreadsheet/9ddb7a97716852c1e20ae55ed88ac0e7/>PikWizard</a>
</span>
</span>
<span class="image-link">
<span
style="margin: 0 0 20px 0; display: inline-block; vertical-align: middle; width: 100%;"
>
<a
target="_blank"
href="https://pikwizard.com/photo/ascending-graph-lines-on-data-dashboard-visual-spreadsheet/9ddb7a97716852c1e20ae55ed88ac0e7/"
style="text-decoration: none; font-size: 10px; margin: 0;"
>
<img src="https://pikwizard.com/pw/medium/9ddb7a97716852c1e20ae55ed88ac0e7.jpg" style="margin: 0; width: 100%;" alt="" />
<p style="font-size: 12px; margin: 0;">PikWizard</p>
</a>
</span>
</span>
Free (free of charge)
Free for personal and commercial use.
Author: Creative Art
Similar Free Stock Images

Premium


Premium


Premium


Premium


Premium


Premium


Premium

Premium


Premium


Premium
Premium


Premium


Premium

Premium


Premium


Premium


Premium


Premium


Premium


Premium


Premium

Premium


Premium

Premium

Premium


Explore More Free Stock Images