- Home >
- Stock Photos >
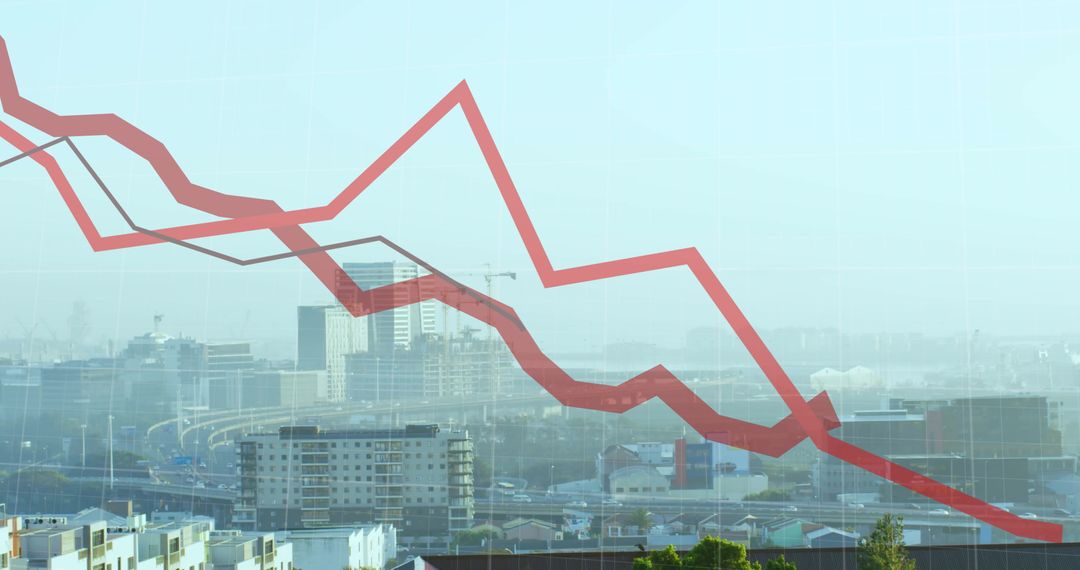
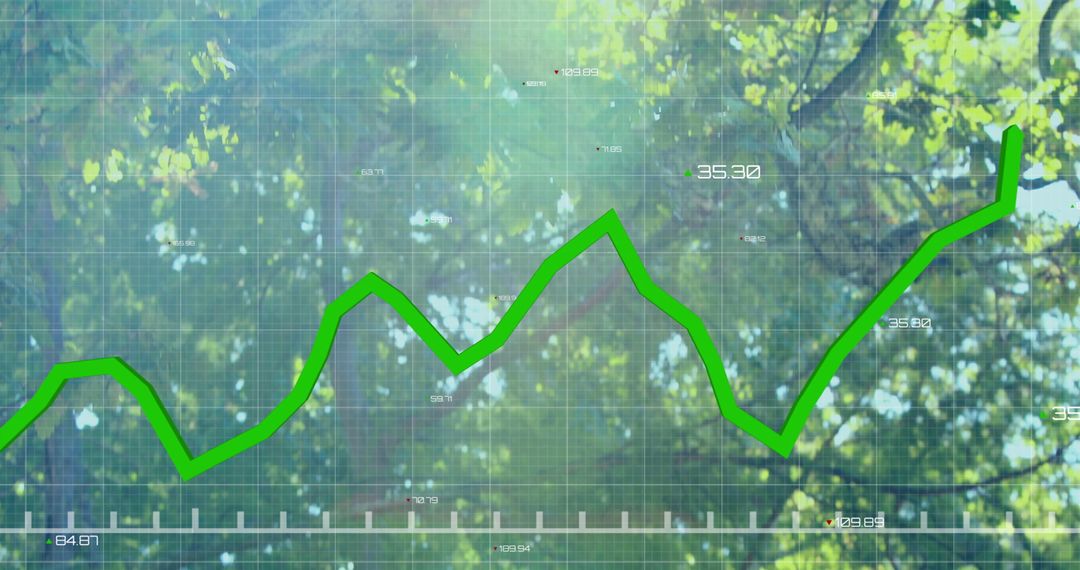
- Ascending Green Line Graph Overlay on Urban Skyline for Business Growth Concept
Ascending Green Line Graph Overlay on Urban Skyline for Business Growth Concept Image

Line graph with green paint indicating upward trend conveys themes of business success and economic growth. Cityscape background provides urban context highlighting connection between finance markets and city life. Useful for illustrating financial reports, growth projections, and ambitious business strategies targeting future opportunities.
Powered by 


2
downloads
downloads
Tags:
More
Credit Photo
If you would like to credit the Photo, here are some ways you can do so
Text Link
photo Link
<span class="text-link">
<span>
<a target="_blank" href=https://pikwizard.com/photo/ascending-green-line-graph-overlay-on-urban-skyline-for-business-growth-concept/7cafd44853326a9630de25706d445f8f/>PikWizard</a>
</span>
</span>
<span class="image-link">
<span
style="margin: 0 0 20px 0; display: inline-block; vertical-align: middle; width: 100%;"
>
<a
target="_blank"
href="https://pikwizard.com/photo/ascending-green-line-graph-overlay-on-urban-skyline-for-business-growth-concept/7cafd44853326a9630de25706d445f8f/"
style="text-decoration: none; font-size: 10px; margin: 0;"
>
<img src="https://pikwizard.com/pw/medium/7cafd44853326a9630de25706d445f8f.jpg" style="margin: 0; width: 100%;" alt="" />
<p style="font-size: 12px; margin: 0;">PikWizard</p>
</a>
</span>
</span>
Free (free of charge)
Free for personal and commercial use.
Author: Authentic Images
Similar Free Stock Images

Premium


Premium


Premium


Premium


Premium


Premium


Premium


Premium


Premium


Premium


Premium


Premium


Premium


Premium


Premium


Premium


Premium


Premium


Premium


Premium


Premium


Premium


Premium


Premium