- Home >
- Stock Photos >
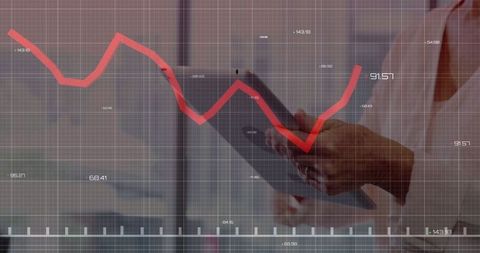
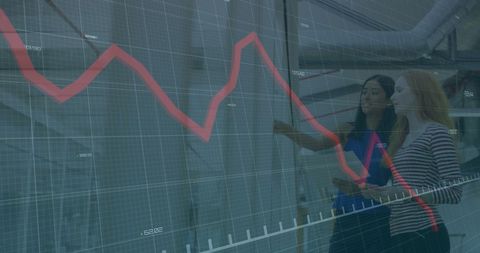
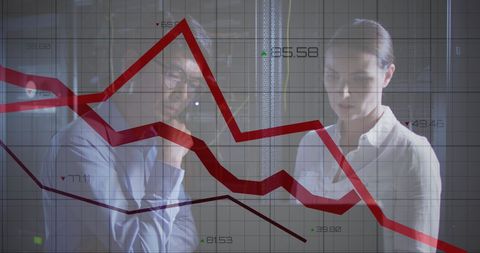
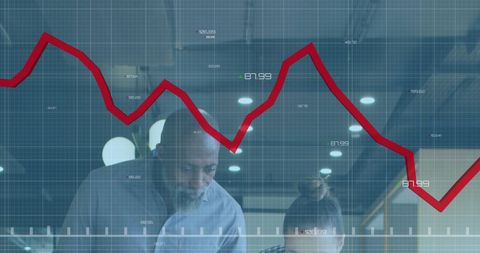
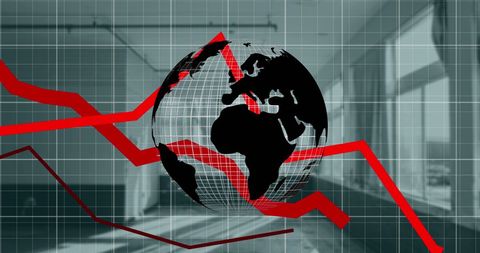
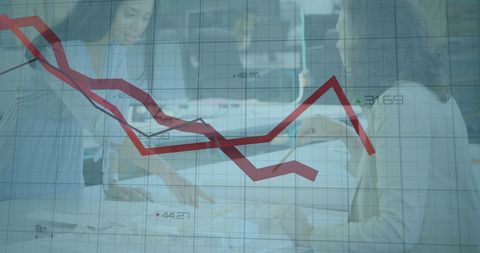
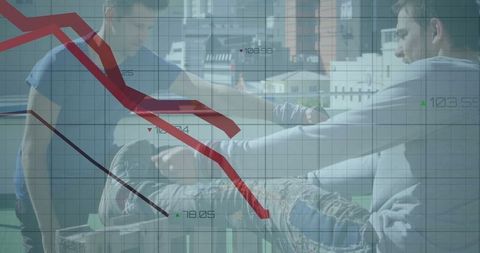
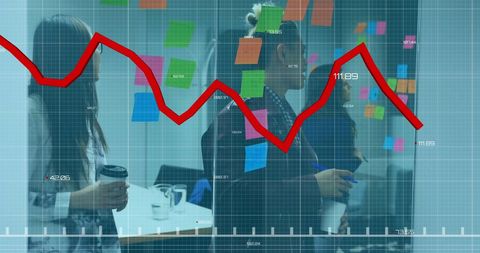
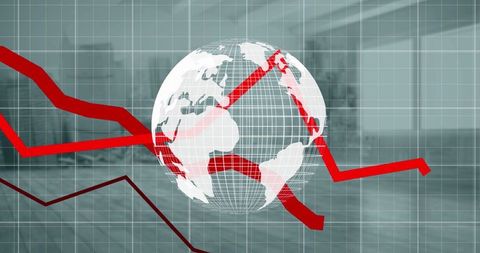
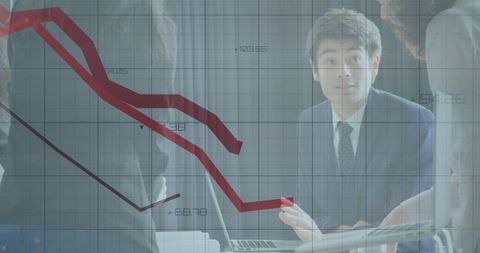
- Asian Professional Analyzing Declining Line Charts with Technology
Asian Professional Analyzing Declining Line Charts with Technology Image
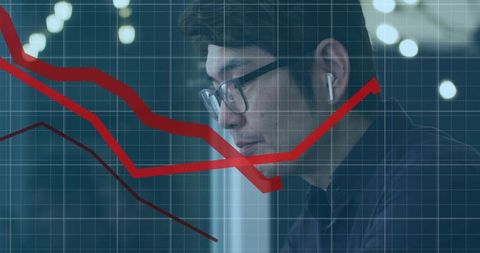
Asian businessman intensely focused on analyzing downturn data on screen, supported by modern technology including earbuds and glasses. Red line represents decline, displayed on grid for ease of analysis, signaling work in finance or business for relevant reports or presentations. Use in articles on financial trends, market analysis, corporate trainings or visual compositions focused on economic discussions.

downloads
Tags:
More
Credit Photo
If you would like to credit the Photo, here are some ways you can do so
Text Link
photo Link
<span class="text-link">
<span>
<a target="_blank" href=https://pikwizard.com/photo/asian-professional-analyzing-declining-line-charts-with-technology/ceeea53829bf90aa3674fdafcf71fdb9/>PikWizard</a>
</span>
</span>
<span class="image-link">
<span
style="margin: 0 0 20px 0; display: inline-block; vertical-align: middle; width: 100%;"
>
<a
target="_blank"
href="https://pikwizard.com/photo/asian-professional-analyzing-declining-line-charts-with-technology/ceeea53829bf90aa3674fdafcf71fdb9/"
style="text-decoration: none; font-size: 10px; margin: 0;"
>
<img src="https://pikwizard.com/pw/medium/ceeea53829bf90aa3674fdafcf71fdb9.jpg" style="margin: 0; width: 100%;" alt="" />
<p style="font-size: 12px; margin: 0;">PikWizard</p>
</a>
</span>
</span>
Free (free of charge)
Free for personal and commercial use.
Author: Awesome Content