
- Home >
- Stock Photos >
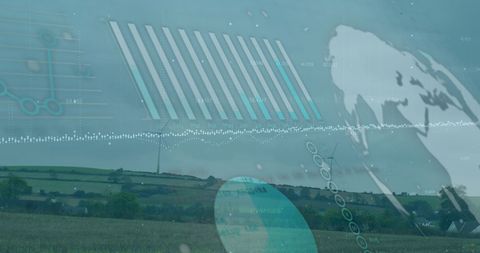
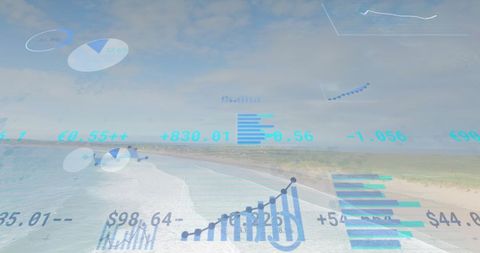
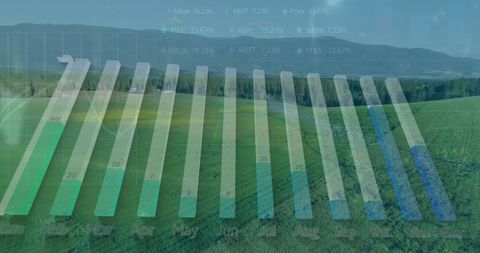
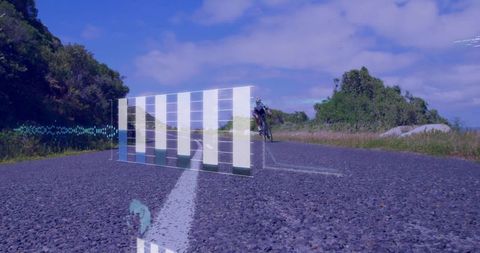
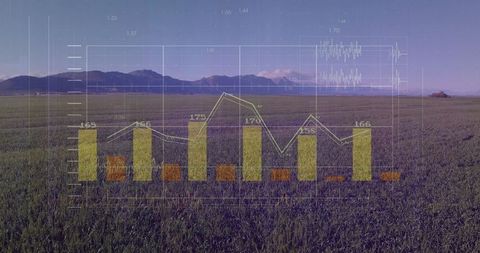
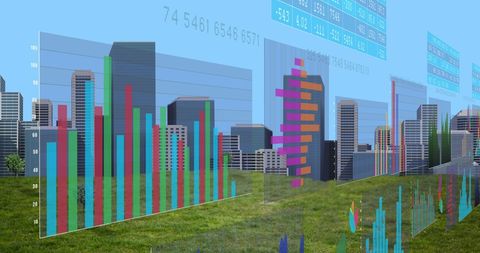
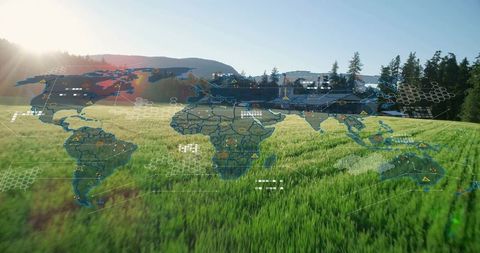
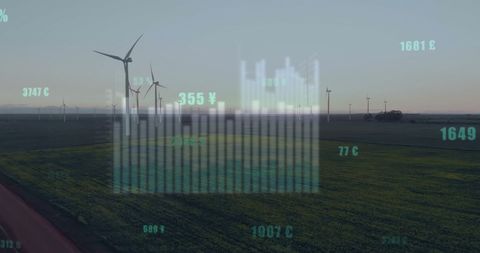
- Augmented Reality Data Visualization Over Rural Field
Augmented Reality Data Visualization Over Rural Field Image
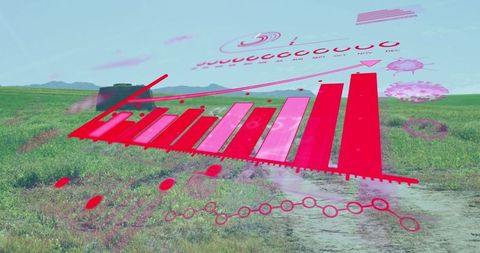
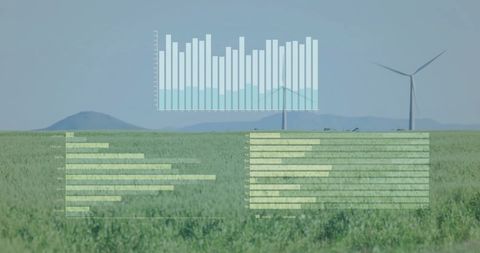
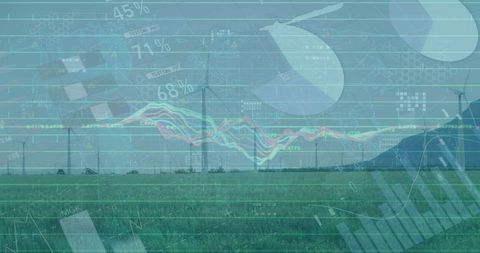
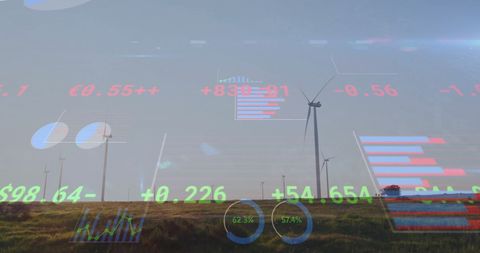
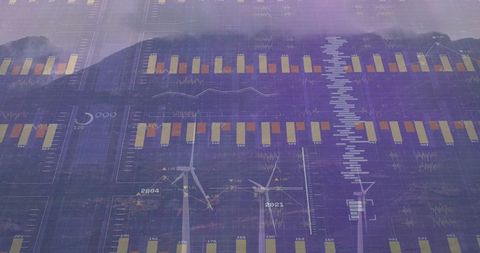
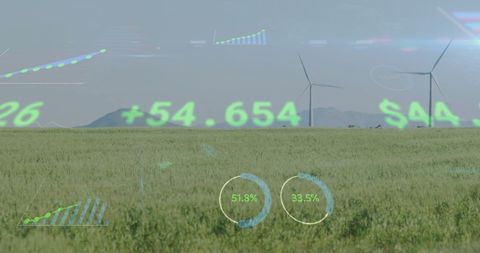
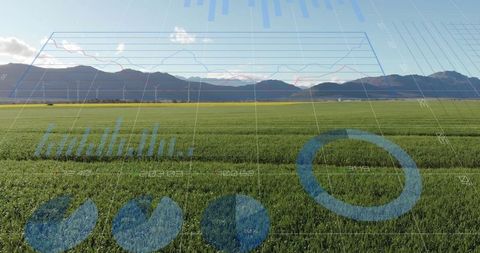
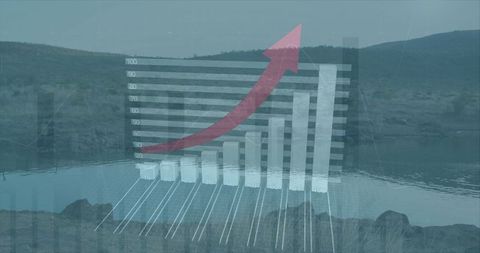
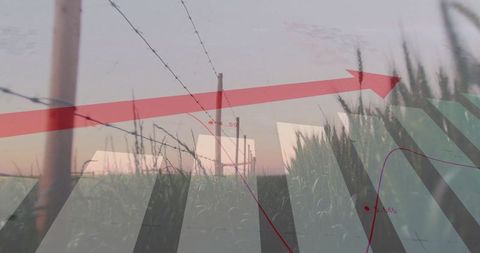
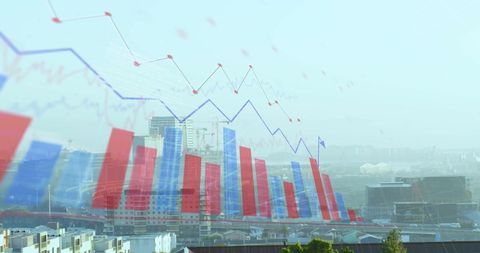
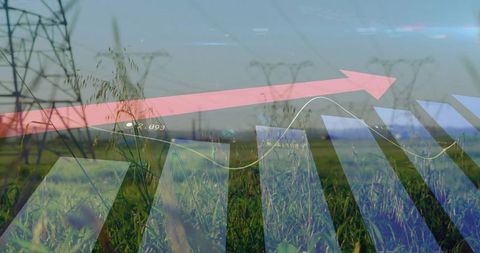
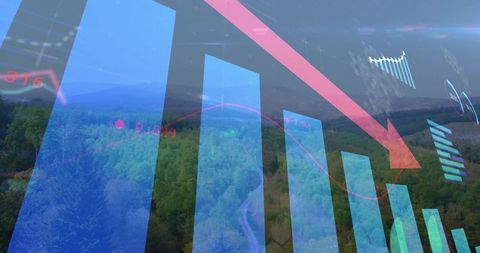
Futuristic augmented reality digital display seamlessly integrates over a rural landscape, showcasing a 3D red bar chart and analytical visuals. Perfect for presentations on technology in agriculture, interactive learning tools, or depicting the intersection of digital innovation in natural environments. Could be useful for educational purposes or illustrating digital transformation in remote areas.
Powered by 


downloads
Tags:
More
Credit Photo
If you would like to credit the Photo, here are some ways you can do so
Text Link
photo Link
<span class="text-link">
<span>
<a target="_blank" href=https://pikwizard.com/photo/augmented-reality-data-visualization-over-rural-field/a9bec4c6fb8be051265bce7867a0b4b7/>PikWizard</a>
</span>
</span>
<span class="image-link">
<span
style="margin: 0 0 20px 0; display: inline-block; vertical-align: middle; width: 100%;"
>
<a
target="_blank"
href="https://pikwizard.com/photo/augmented-reality-data-visualization-over-rural-field/a9bec4c6fb8be051265bce7867a0b4b7/"
style="text-decoration: none; font-size: 10px; margin: 0;"
>
<img src="https://pikwizard.com/pw/medium/a9bec4c6fb8be051265bce7867a0b4b7.jpg" style="margin: 0; width: 100%;" alt="" />
<p style="font-size: 12px; margin: 0;">PikWizard</p>
</a>
</span>
</span>
Free (free of charge)
Free for personal and commercial use.
Author: People Creations
Similar Free Stock Images
Premium

Premium

Premium


Premium

Premium


Premium


Premium


Premium

Premium

Premium

Premium


Premium

Premium


Premium


Premium


Premium


Premium


Premium


Premium


Premium


Premium


Premium


Premium


Premium


Premium

Explore More Free Stock Images