1. Home > 
  2. Stock Photos > 
  3. Balance Between Time and Wealth with Data Graphs

Balance Between Time and Wealth with Data Graphs Image

Balance Between Time and Wealth with Data Graphs

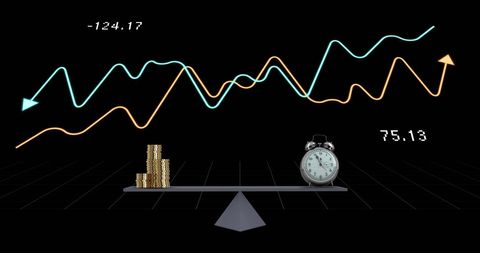
Visual representing financial balance measured by time versus money, enhanced with dynamic data graphs. Ideal for illustrating concepts related to time management, financial investments, and business optimization strategies.

Powered by Adobe logo
Using tablet pc, Consultant between bookkeepers and accounting lawyer consultation about asset, balance sheet, stock market statistics and yearly tax law, protect business from bribery. - Powered by Adobe AI, data analysis. Business people use AI to analyze financial related data. big data Complex performance measurement With modern innovative technology - Powered by AdobeSecure financial payment processing illustration with a credit card and NFC terminal, representing modern digital transactions and fintech technology. - Powered by AdobeBusiness analysis reports with charts and graphs. Integrated content management platform. Digital document automation. Businessperson holding reports. - Powered by AdobeVisual representation of financial growth featuring upward charts and graphs, highlighting data trends in a digital environment focused on business success and investment strategies. Copula - Powered by Adobe

Credit Photo

If you would like to credit the Photo, here are some ways you can do so

Free (free of charge)

Free for personal and commercial use.

Author: People Creations

Similar Free Stock Images

Colorful Stock Market Graph on World Map Background
Premium
Health care, insurance, medical protection, online system, patient safety, hospital services, claim process, digital healthcare, health technology, secure data, policy coverage, medical plan.
Financial Data Analysis with Digital Grid Chart
Digital Charts and Financial Data Background in Blue Tones
Fluctuating Financial Graph With Data Visualization
Digital Dashboard with Data Graph Lines in Motion
Premium
Image of financial data processing over city
Digital Financial Graph with Rising Line Trend on Dark Background
Financial Graph with Line Trending Upwards on Navy Background
Futuristic Data Processing with Eye Interface Symbol
Futuristic Financial Data Interface and Analysis Display
Premium
From above of crop anonymous female dealer touching screen of cellphone with graphs while sitting on meadow
Financial Data Charts and Graphs on Digital Interface
Dynamic Financial Data Charts on Dark Digital Background
Interactive Financial Data Analysis with Digital Technology
Cityscape Blended with Graphs Showing Finance Trends
Premium
Digital Banking Security: A Futuristic Representation of Financial Technology with Glowing Blue Bank Building on a Circuit Board Background.
Downward Trending Graph with Office Background
Dynamic Financial Data Displayed on Neon Graphs
Dynamic Digital Dashboard with Sustainable Energy Indicators
Cybersecurity Data Analysis with Growth Trend Chart
Premium
Businesswoman approving digital invoice on tablet and laptop with financial document icons. Concept of paperless billing, e-invoice management, and online finance workflow.
Fluctuating Stock Chart Overlay in Modern Office Environment
Financial Graphs and Digital Data on Dark Background
Digital Data Visualization with Graph Charts on Dark Background
Magnifying Glass with Data Processing Digital Concept
Premium
Online document validation and quality assessment management, businessman reviewing checklist for business document evaluation, consulting, and market data report analysis.
Abstract Data Chart with Graphical Patterns
Digital Stock Market Data with Upward Trend Graph
Abstract Financial Graphs with Red Trend Lines
Futuristic Data Analytics Dashboard with Neon Graphs
Colorful Digital Stock Market Graph Over Grid Background
Futuristic Financial Charts with Virtual Arrows
Premium
Businessman analyze and visualize complex information on a virtual screen using AI to process data. Big data technology and data science.Data flow.Digital neural network.artificial intelligence
Financial Data Chart Over City Silhouette
Neon Data Graph Overlay on Car Dashboard Concept Display
Digital Data Interface on Car Panel with Financial Trends
Digital Dashboard Showing Financial Analysis with Graphs
Premium
Digital invoice processing, billing management. man using laptop to managing payment, checklist financial workflow, electronic statements. Online invoice processing and tax accounting solutions.
Abstract Financial Graph on Dark Digital Background
Dynamic Financial Data with Vibrant Graph Arrows
Global Economic Trends Overlaid on World Map
Digital Stock Market Data Over Cityscape Concept
Premium
Credit card connected to chip of pos terminal, futuristic view of hand and digital contactless payment. Concept of data, tech, bank, online, pay, technology,
Digital Interface with Rising Financial Graph Trends
Digital Graphs and Interfaces Representing Data Analysis on Green Background
Futuristic Financial Data Analysis with Rising Stock Chart
Digital Financial Chart Showing Growth and Dynamic Indicators
Premium
Big data and AI technology, Business intelligence and AI data science, Automating data processing, Machine learning and business intelligence, AI driven data processing, KPI performance monitoring.
Dynamic Waves and Graphs on Black Background
Data Processing and Business Analytics Visualization
Futuristic Data Visualization with Technology HUD Interface
Data Analysis Through Advanced Computer Interface Display
Premium
Two business people talk project strategy at office meeting room. Businessman discuss project planning with colleague at modern workplace while having conversation and advice on financial data report.
Dynamic Financial Data Analytics and Stock Market Trends
Abstract Data Visualization with Neon Waveforms
Digital Fintech Visualization with Graphs and Data Icons
Stock Market Decline Data Analysis on Dark Grid Background
Premium
A focused businesswoman in a black suit analyzes data insights using a computer with financial graphs. The scene captures a modern office environment dedicated to success. Copula
Digital Data Analysis on Futuristic Black Background
Futuristic Data Dashboard Showing Dynamic Red Line Graph
Virtual Data Analysis with Graphs and User Icons
Rising Green Line on Financial Digital Display
Digital Financial Data with Trending Arrows
Digital Financial Data Representation with Abstract Graph
Premium
Medical Coding Bill And Billing Codes
Abstract Financial Graphs and Data Analysis
Abstract Data Analysis Over Digital Interface
Pulse Trace Illustration Promoting Heart Health Awareness
Fluctuating Graph on Green Grid Background Illustrating Financial Trends
Premium
Business Decisions through advanced data visualization and interactive analytics, AI generative
Complex Financial Data Visualizing in Digital Interface
Dynamic Financial Charts on Global Digital Grid Background
Business Data Analysis with Red Declining Graph on Office Desk Background
Digital Data Processing Background with Dynamic Lines
Premium
Expert woman asian people discuss review data number costing managerial account prepare monthly actual cost variance report income tax at audit office. ESG budget control ERP process service project.
Futuristic Digital Data Visualization with Green Interfaces
Digital Holographic Data Interface Display
Cyber Security with Data Wave and Digital Padlock Scanner
Animated Financial Data with Heartbeat Overlapping Lines
Premium
AI-Powered Investing Robotic Automation in Financial Markets
Animated Financial Chart Depicting Stock Market Trends
Abstract Business Analytics with Diverse Data Graphs and Scanner Interface
Dynamic Financial Data Visual Display with Graph Annotations
Dynamic Stock Market Graph Fluctuating in Modern Office
Premium
Secure Online Payment Methods  A Guide to Safe and Efficient Digital Transactions
Data Processing with Abstract Graph and Digital Interface
Digital Data Processing with Abstract Financial Graph on Green Background
Fluctuating Stock Market Graph with Dramatic Peaks
Futuristic Data Analysis with Digital Graphs on Gradient
Premium
Businessman pointing on NLP natural language processing for command and support ai automation working and big data analysis communication in auto chatbot and machine learning
Dynamic 3D Forex Line Graph on Digital Grid Display
Dynamic Social Media Analytics with Digital Line Graphs
Financial Market Decline on Digital Screen With Red Line Graph
Financial Data Analysis with Vibrant Lines on Blue Background
Digital Financial Graph and Data Display on Blue Background
Financial Graph and Cityscape Analysis with Technological Overlay
Premium
Businessman managing invoices online using laptop, showcasing financial management, document processing, and modern accounting practices for efficiency and better control.
Digital Financial Graph Interface on Car Dashboard over Industry Trends
Dynamic Financial Growth Chart on Digital Screen
Financial Growth Arrows on Digital Grid Base
Digital Currency Data Analysis and Encryption Motif
Premium
AI automation streamlines business process management, workflow integration, and resource planning with enterprise software, enabling efficient datum transfer and system flow optimisation
Green Financial Data Line Graph Over Cityscape Background
Global Finance and Technology Concept with Dynamic Charts
Financial Data Growth Over Urban Cityscape with Graph Overlay
Dynamic Data Visualisation with Futuristic Digital Display
Premium
Data center with a blurred image of the data. Video of financial information server with realistic visualization. International commerce and financial management lifestyle room with interfaces.
Financial Market Chart on Digital Screen Showing Growing Trends
Digital Financial Data and Multicurrency Exchange Charts
Global Network Analysis with Dynamic Digital Data
Neon Stadium and Data Integration in Digital Interface
Premium
Digital financial approval concept. A person works on a laptop with floating digital icons representing financial operations, including a green checkmark indicating successful approval.
Dynamic Data Visualization in Abstract Interface Design
Digital Interface with Data Analysis Graphics on Blue Background
Global Economic Growth Trends with Digital World Map
Abstract Financial Graph Displayed on Office Monitor
Premium
Magnifying glass document management checklist. Magnifying glass check mark approved. Audit certificate evaluate examination reviewing. Magnifying inspector inspect quality Assurance selection summary
Financial Data Analysis with Declining Trend on Blueprint Graph
Green Line Graph Overlaid on Empty Office with Data Overlay
Dynamic Financial Data Analysis Concept with Graph Lines and Orange Background
Red Line Graph Overlaying Office Computers Symbolizing Data Analysis
Premium
Man typing on laptop with digital receiving invoice and document management icons. Business accounting, data processing, and automation technology for financial operations productivity
Futuristic 3D Financial Dashboard Displaying Neon Cyan Orange Line Charts with Grid View