
- Home >
- Stock Photos >
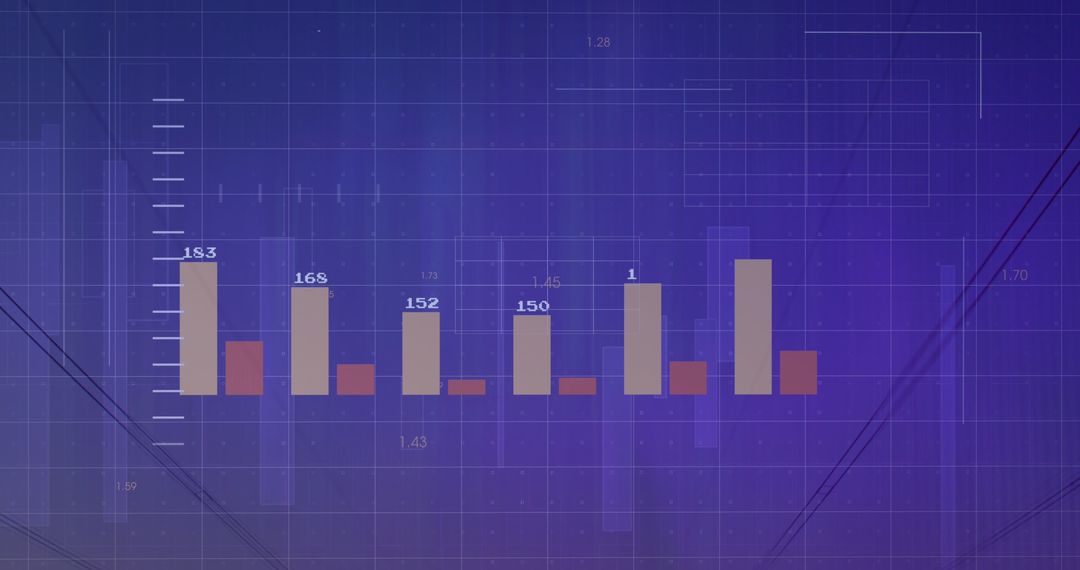
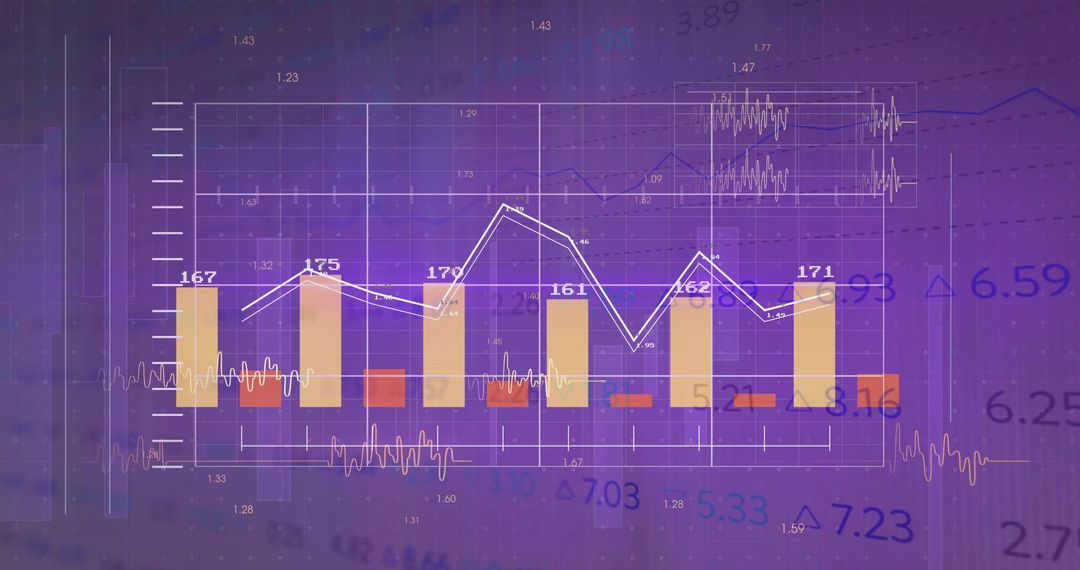
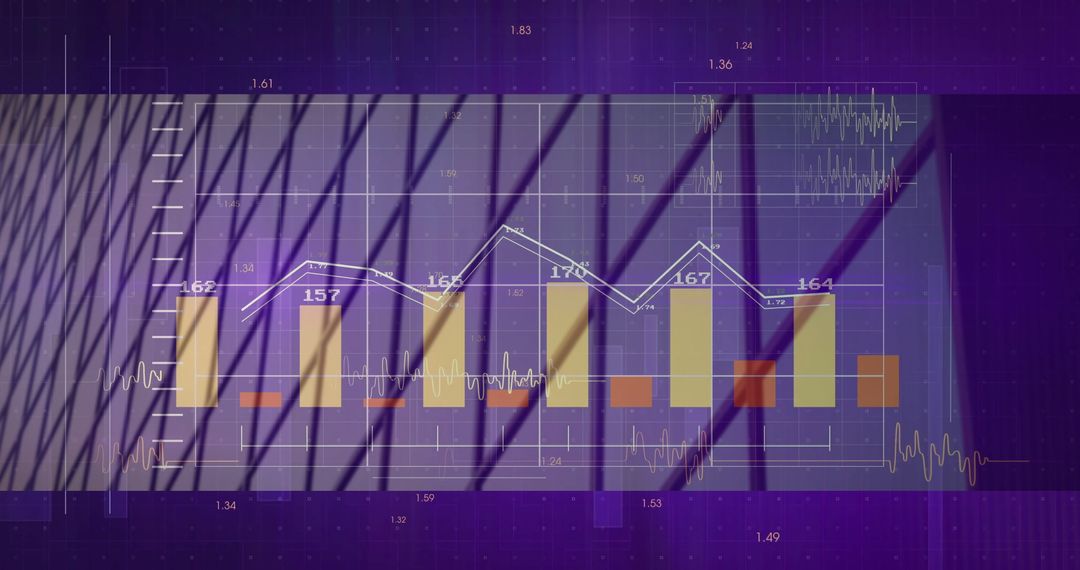
- Bar and Line Charts on Purple Gradient Grid for Data Analysis
Bar and Line Charts on Purple Gradient Grid for Data Analysis Image

This digital image showcases a combination of bar and line charts against a purple gradient grid backdrop, with a modern and abstract feel. Ideal for use in presentations, blog posts, and reports where data analytics and visualization are discussed. Suitable for educational contexts aimed at visualizing statistics, or detailed infographics related to business and technology.
Powered by 


2
downloads
downloads
Tags:
More
Credit Photo
If you would like to credit the Photo, here are some ways you can do so
Text Link
photo Link
<span class="text-link">
<span>
<a target="_blank" href=https://pikwizard.com/photo/bar-and-line-charts-on-purple-gradient-grid-for-data-analysis/fc451579e921a68e34a71bc2de7173a4/>PikWizard</a>
</span>
</span>
<span class="image-link">
<span
style="margin: 0 0 20px 0; display: inline-block; vertical-align: middle; width: 100%;"
>
<a
target="_blank"
href="https://pikwizard.com/photo/bar-and-line-charts-on-purple-gradient-grid-for-data-analysis/fc451579e921a68e34a71bc2de7173a4/"
style="text-decoration: none; font-size: 10px; margin: 0;"
>
<img src="https://pikwizard.com/pw/medium/fc451579e921a68e34a71bc2de7173a4.jpg" style="margin: 0; width: 100%;" alt="" />
<p style="font-size: 12px; margin: 0;">PikWizard</p>
</a>
</span>
</span>
Free (free of charge)
Free for personal and commercial use.
Author: Creative Art
Similar Free Stock Images

Premium


Premium


Premium


Premium


Premium


Premium


Premium


Premium


Premium


Premium


Premium


Premium


Premium


Premium


Premium


Premium


Premium


Premium


Premium


Premium


Premium


Premium


Premium


Premium

