- Home >
- Stock Photos >
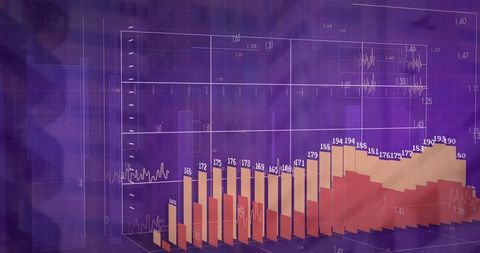
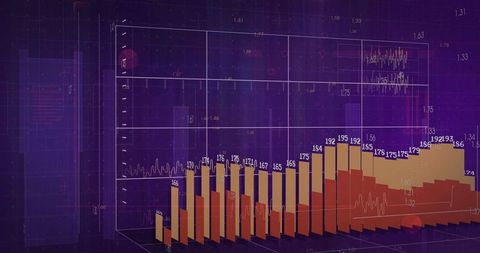
- Bar and Line Graph Data Visualization in Purple Gradient Background
Bar and Line Graph Data Visualization in Purple Gradient Background Image
Colorful chart combining bar and line graphs illuminating statistics over purple gradient backdrop, symbolizes analytical thinking, business intelligence. Useful in presentations, educational materials, analytical reports, data-driven content.

downloads
Tags:
More
Credit Photo
If you would like to credit the Photo, here are some ways you can do so
Text Link
photo Link
<span class="text-link">
<span>
<a target="_blank" href=https://pikwizard.com/photo/bar-and-line-graph-data-visualization-in-purple-gradient-background/7a02aedb74698a6edf1ff2bd4d1d0cda/>PikWizard</a>
</span>
</span>
<span class="image-link">
<span
style="margin: 0 0 20px 0; display: inline-block; vertical-align: middle; width: 100%;"
>
<a
target="_blank"
href="https://pikwizard.com/photo/bar-and-line-graph-data-visualization-in-purple-gradient-background/7a02aedb74698a6edf1ff2bd4d1d0cda/"
style="text-decoration: none; font-size: 10px; margin: 0;"
>
<img src="https://pikwizard.com/pw/medium/7a02aedb74698a6edf1ff2bd4d1d0cda.jpg" style="margin: 0; width: 100%;" alt="" />
<p style="font-size: 12px; margin: 0;">PikWizard</p>
</a>
</span>
</span>
Free (free of charge)
Free for personal and commercial use.
Author: Authentic Images