- Home >
- Stock Photos >
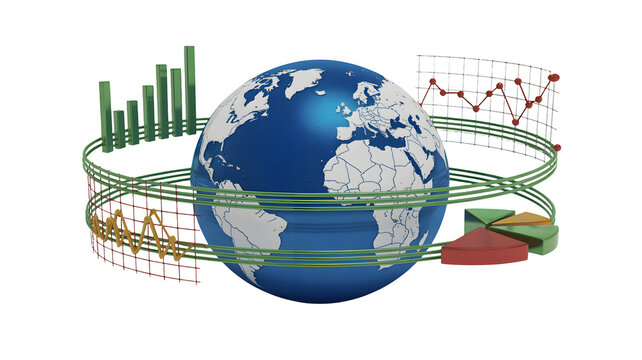
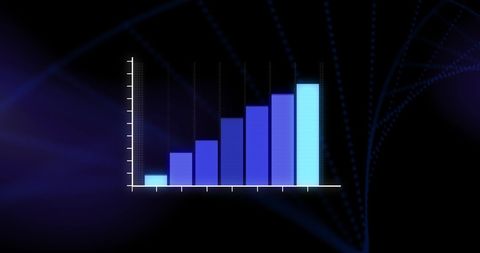
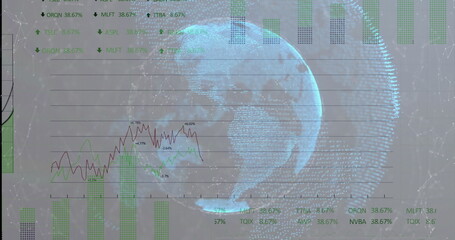
- Bar Chart and Line Graph with Digital Globe and Network Connections
Bar Chart and Line Graph with Digital Globe and Network Connections Image

Illustrates concept of global business and analytics using visualization tools. Suitable for presentations on global data insights, technology trends, business analysis, or economics. Useful in reports, websites, or content for finance and analytics sectors, emphasizing connectivity and worldwide reach.
Powered by 


downloads
Tags:
More
Credit Photo
If you would like to credit the Photo, here are some ways you can do so
Text Link
photo Link
<span class="text-link">
<span>
<a target="_blank" href=https://pikwizard.com/photo/bar-chart-and-line-graph-with-digital-globe-and-network-connections/eae75e2931e53bc698565cac546c2045/>PikWizard</a>
</span>
</span>
<span class="image-link">
<span
style="margin: 0 0 20px 0; display: inline-block; vertical-align: middle; width: 100%;"
>
<a
target="_blank"
href="https://pikwizard.com/photo/bar-chart-and-line-graph-with-digital-globe-and-network-connections/eae75e2931e53bc698565cac546c2045/"
style="text-decoration: none; font-size: 10px; margin: 0;"
>
<img src="https://pikwizard.com/pw/medium/eae75e2931e53bc698565cac546c2045.jpg" style="margin: 0; width: 100%;" alt="" />
<p style="font-size: 12px; margin: 0;">PikWizard</p>
</a>
</span>
</span>
Free (free of charge)
Free for personal and commercial use.
Author: Awesome Content
Similar Free Stock Images
Loading...

Premium


Premium


Premium


Premium

Premium


Premium


Premium

Premium


Premium

Premium


Premium

Premium


Premium


Premium

Premium


Premium


Premium

Premium


Premium


Premium


Premium


Premium


Premium


Premium


Premium