1. Home > 
  2. Stock Photos > 
  3. Bar Chart Displaying Data Against Alphanumeric Background

Bar Chart Displaying Data Against Alphanumeric Background Image

Bar Chart Displaying Data Against Alphanumeric Background

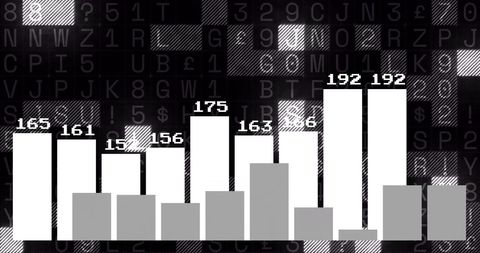
Bar chart with vertical bars showing numerical data. Used for presenting analytics or statistics. Ideal for presentations on business insights, analysis or reporting.

Powered by Shutterstock logo - Get 15% off with code: PIKWIZARD15
Business data analysis dashboard showing charts, statistics, and performance metrics for decision-making, revenue tracking, and strategic planning in organizations Latch - Powered by Shutterstock - Get 15% off with code: PIKWIZARD15A person analyzing data through colorful bar graphs displayed on a laptop in a modern workspace. The vibrant visuals represent metrics and performance trends. - Powered by Shutterstock - Get 15% off with code: PIKWIZARD15Displaying six-bar chart and line graph on data analytics interface, with waveforms and data labels. Data, visualization, technology, interface, charts, analysis, digital - Powered by Shutterstock - Get 15% off with code: PIKWIZARD15Displaying bar line chart in purple gradient, with yellow red bars and labeled white line graph. Analytics, data visualization, infographics, dashboard, digital interface, graphical report, business - Powered by Shutterstock - Get 15% off with code: PIKWIZARD15Business professional analyzing interactive digital bar charts to monitor performance metrics and drive data-driven decision-making in real-time. - Powered by Shutterstock - Get 15% off with code: PIKWIZARD15

Credit Photo

If you would like to credit the Photo, here are some ways you can do so

Free (free of charge)

Free for personal and commercial use.

Author: Creative Art

Similar Free Stock Images

Digital Timer Overlay on Urban Cityscape with Data Concept
Premium
A professional presenting data visualizations with bar charts and pie charts, signifying analytics or financial performance.
Abstract Financial Graph on White Background
Abstract Digital Interface Showing Data Flow and Statistics
Premium
Displaying bar chart with line overlay at dashboard, with sparkline waveforms and rectangles. Data, analytics, visualization, dashboard, infographics, digital, technology
Abstract Financial Graph Illustration on Dark Background
Green Binary Code Falling on Black Background with Digital Tech Vibe
Abstract Green Digital Security Data Overlay
Digital Financial Chart on Green Background with Figures
Premium
Business data analysis dashboard showing charts, statistics, and performance metrics for decision-making, revenue tracking, and strategic planning in organizations Latch
Glowing Rectangles on Green Background with Futuristic Effect
Digital Graph with Rising and Falling Lines on Grid Background
Abstract Global Connections with Digital Interface Concept
Green Digital Matrix Background with Binary Code Streams
Premium
Displaying translucent bars with overlaying pinkish-red line graph over sky grid, showing data. Analytics, visualization, digital, infographic, tech, abstract, finance
Control Console Displaying Error Logs with Blue Row Highlight and Dotted Globe Data Overlay
Digital Binary Matrix Code Abstract Background
Vibrant Geometric Pattern in Dynamic Blue Tones
Dynamic Financial Chart with Glowing Pulse Indicators
Green Binary Code Data Stream on Black Background
Dynamic Geometric Tile Interface with Luminous Background
Question Marks Hovering Over Complex Gray Maze Background
Futuristic Data Flow with Binary Code Patterns
Premium
Business data visualization dashboard analytic on laptop screen business data scientist with ai analysis and bar, donut, pie chart data summarise management digital market statistic summary analytics
Data and Financial Analysis Abstract Background
Abstract Digital Chart in Futuristic Financial Analysis Concept
Abstract Financial Charts in Futuristic Design
Abstract Financial Graph Overlay with Data Networks
Premium
Business and finance growth concept. Businessman points to increasing percentage bar graph with digital line graph. Increasing profit, return analysis and economy inflation trend.
Digital Interface with Binary Code and Networks
Green Binary Code Flow Over Black Background
Green Pixelated Triangular Pattern on Black
Abstract Financial Data Display with Upward Graph Curves
Digital Gaming Matrix Background with Gamepad Icon
Dimensional Abstract Geometric Digital Pattern
Data Processing on Black and Blue Screen with Digital Components
Abstract Binary Code Wave on Digital Data Processing Grid
Premium
Gesturing toward a glowing bar graph overlaying a laptop. The graph represents data analytics, showcasing various percentages and trends, symbolizing financial growth and technology integration.
Digital Financial Data Graph on Green Grid Background
Premium
Rating Evaluation and Performance Improvement concept. Draws a rising curve with five stars above a bar chart, review, ranking improvement, evaluation and classification in a business or service.
Binary Code Streaming on Digital Screen Background
Abstract Blockchain Technology with NFT and Cubes
Premium
Displaying dashboard presenting metrics in office space with bar charts, line graphs and data grid. Technology, data, analytics, business, innovation, visualization, modern
Abstract Financial Data with Digital Interface Representation
Abstract Digital Connections with 3D Cubes and Green Background
Digital Interface with Pulsating Binary Code Matrix
Glowing Digital Grid Background with Modern Technology Feel
Premium
Displaying digital dashboard in office, with bar chart, pie segments, grid lines and data labels. Technology, data visualization, analytics, innovation, business, modern, futuristic
Glowing Circuit Board Over Binary Code Abstract Background
Abstract Black and White Cube Network on White Background
Glowing Green Binary Code Cascades in Digital Landscape
Neon Glowing Network Connections Abstract Conceptual AI Brain
Premium
Displaying bar chart overlaying cloudy sea, with red descending arrow, curved line graph and labels. Data visualization, analytics, trend analysis, financial, business intelligence, modern,
Futuristic Digital Interface with Codes and Light Patterns
Close-Up of Marked Calendar Page with Pen
Abstract Digital Financial Graph Overlay on White Background
Digital Financial Graph Representing Market Trends
Digital Data Processing with Financial Analysis Graphics
Abstract Green Binary Code with Digital Effects
Futuristic Bull Graph Financial Technology Interface
Glowing Green NFT Text Digital Finance Background
Dynamic Green Graph with Digital Data on Dark Background
Premium
Businessman analyzing financial data, bar chart, future stock market trends, growth forecast 2025, financial investment, gold market, stock market forecast analysis concept.
Virtual Financial Data Analytics on White Background
Green Binary Code on Black Matrix Background
Premium
Businessman pointing at rising bar chart with glowing arrows and 2026 goal icon. Concept of business growth, data analytics, performance metrics, and future financial strategy planning.
Premium
Business data analysis dashboard showing charts, statistics, and performance metrics for decision-making, revenue tracking, and strategic planning in organizations Latch
Abstract Financial Data Analytics Background
Abstract Digital Financial Data Chart with Pink Line Oscillations
Futuristic Circuitry on Blue Background
Premium
Business data analysis dashboard showing charts, statistics, and performance metrics for decision-making, revenue tracking, and strategic planning in organizations Latch
Glowing Geometric Digital Grid with Neon Colors
Uncertainties Amidst Complex Maze Illustrating Decision-Making Challenges
Dynamic Digital Data Visualization with Dot Graph Design
Digital Data Visualization with Blue Grid and Timeline
Digital Financial Chart on Black Background with Neon Lines
Premium
Businessman analyzing digital data graph with yearly growth trends and bar charts. Concept of financial forecast, KPI dashboard, and business performance analytics.
Digital Data Visualization with Abstract Line Graphs
Binary Code Matrix Falling Graphic Background
Digital Data Processing with Scope Scanning Interface
Abstract Digital Data with Geometric Patterns on White Background
Premium
Businessman reading data in bar graph and pie chart form on virtual data analytic dashboard in office. Business analysis for investment and online digital marketing
Premium
hand of Business Person Analyzing Financial Bar Graph Data, Financial Performance Report Analysis with Charts and Statistics
Green Binary Code on Black Background for Data Processing Theme
Floating Bitcoin Symbols Over Digital Matrix Background
Abstract Digital Financial Data and Graph Overlay
Digital Green Economy Data Visualization with Floating Numbers
Premium
Hand pointing at upward bar chart graph, business growth, success metrics, financial performance, data analysis, smart digital marketing, strategy and planning. Monthly KPIs, trend tracking.
Bar Line Chart Display in Technology Workspace with Grid Background
Abstract Financial Chart Background with Bar and Line Graphs
Confused Woman Shrugging with Maze Background and Question Marks
Abstract Digital Circuitry with Flowing Binary Data Streams
Premium
Dashboard showing bar charts and line graph in digital interface, numeric labels and gauge charts. Data visualization, analytics, dashboard, metrics, digital interface, finance, technology
Abstract Financial Data and Statistical Graphs on White Background
Digital Stock Market Data with Glowing Loss Indicator
Green Binary Code on Black Background
Neon Frame Over 3D Graph on Blue Background
Digital Data Streams on Dark Background
Isometric Cube Pattern on Blue Background with Copy Space
Data Processing Interface with Graph Overlay on Black Background
LED Dot Financial Graph on Red Digital Background
Abstract Financial Charts with Graphs and Data Visualization
Abstract Blockchain Concept with Interconnected Cubical Blocks
Green Binary Code Streaming on Black Background, Energy of Data Flow
Abstract Financial Data Chart on Clean White Background
Digital Matrix with Green Text and Lights
Premium
Displaying vertical bar chart over blurred city skyline, with numeric labels line graph grid lines. Analytics, finance, data visualization, digital, modern, technology, business
Digital Network and Data Movement Concept Art
Financial Data Visualized with Bar and Line Graphs on Dynamic Background
Abstract Black and White Geometric Spiral Design
Futuristic Financial Graph and Data Network Integration
Premium
Displaying data dashboard on blurred circuit board with bar chart, line graph and numeric labels. Technology, analytics, digital, innovation, interface, visualization, hardware
Dynamic Digital Data Analysis on Elevated Grid
Abstract Binary Code Background for Digital Networks
Futuristic Binary Code and Digital Blocks in Virtual Space
Abstract Financial Data and Graph Analysis Concept
Premium
Diverse female accountant analyzing a bar chart infographic on a presentation board in an office.
Heartbeat Medical Data over Computer Screen BluePulse Digital Concept
Analyzing Financial Data with Graphs and Charts
Futuristic Digital Data Stream with Green Binary and Code Grids
Premium
Hand holding bar graph with percentage icons, representing interest rate adjustment, investment return, inflation control, finance growth, discount strategy, and digital economic analysis.
Premium
Person analyzing bar and line chart on laptop showing sales versus growth target in a business performance report. Financial data analysis, revenue tracking, and market trend evaluation concept.
Abstract Financial Chart Patterns on Digital Screen
Green Question Marks Floating Over Complex Grey Maze
Digital Security Lock with Binary Code Overlay
Explore More Free Stock Images