- Home >
- Stock Photos >
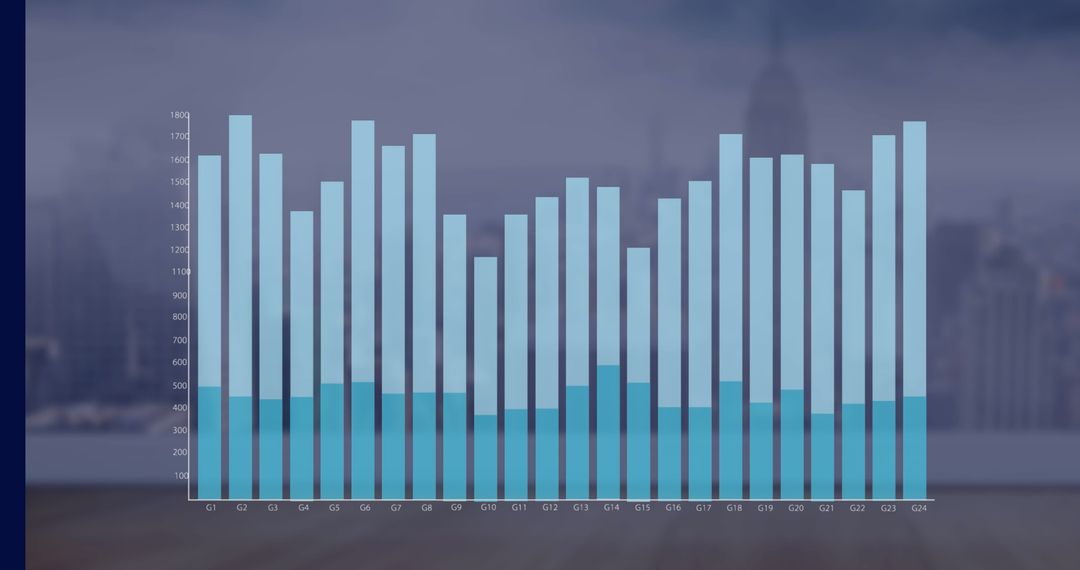
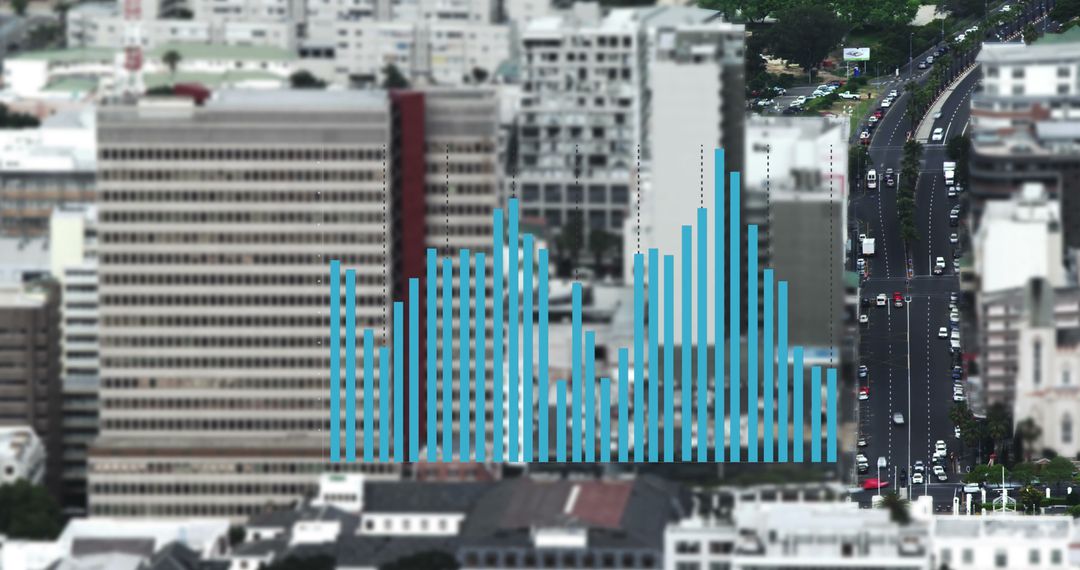
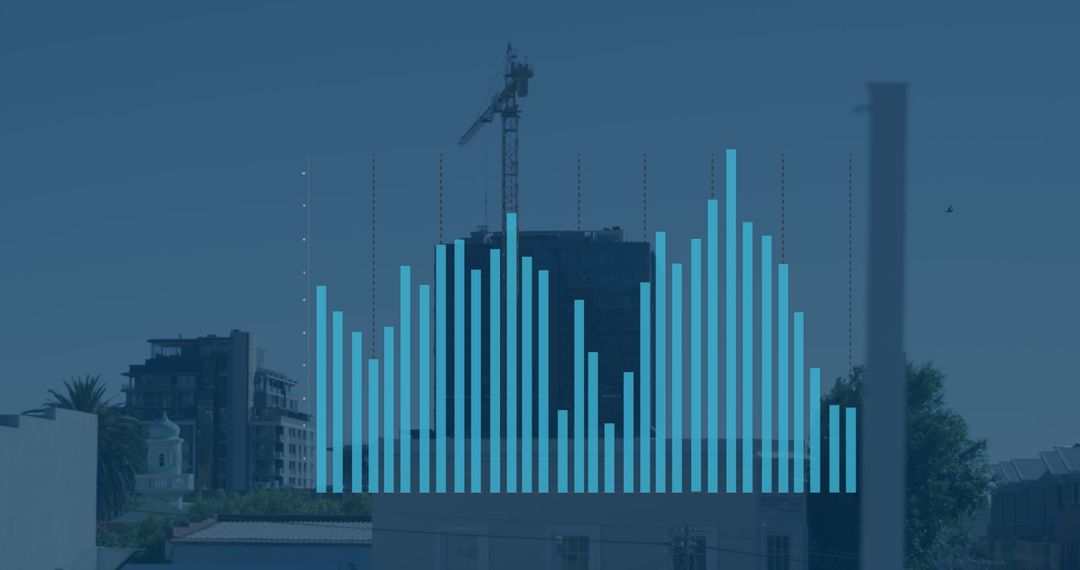
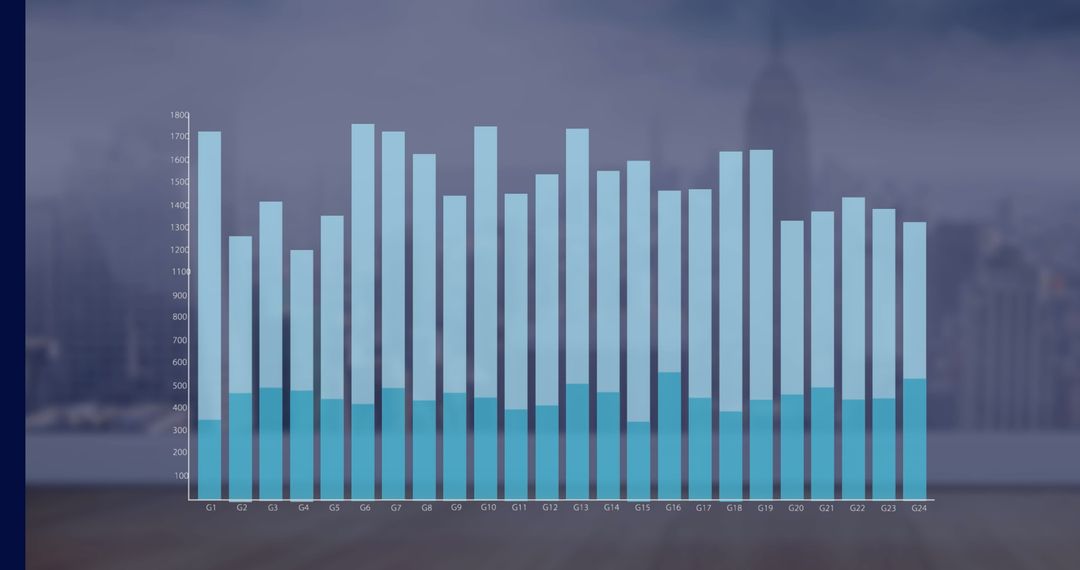
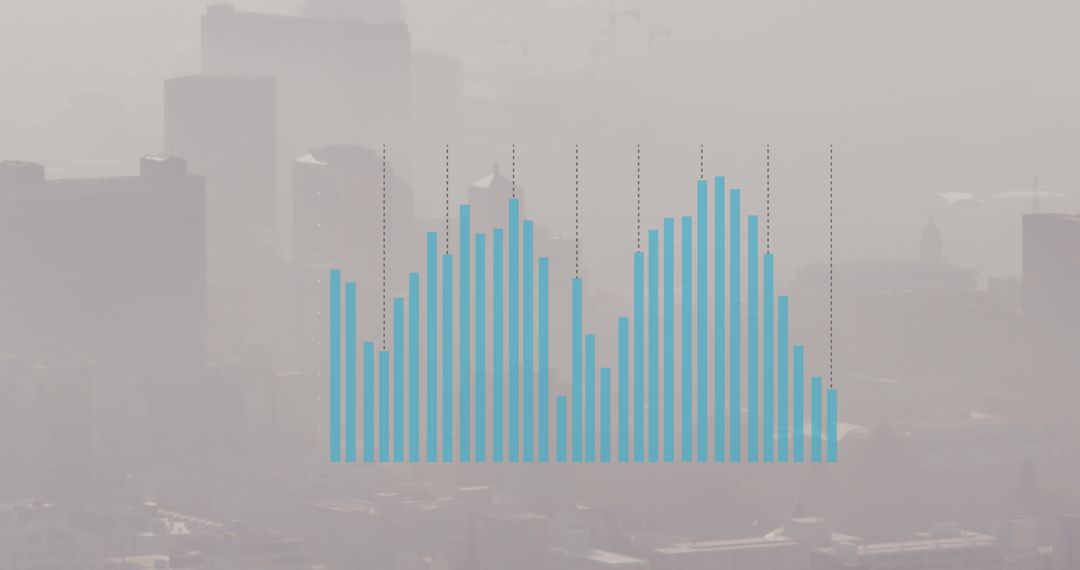
- Bar Graph Overlay on City Skyline Illustrating Data Analysis Concept
Bar Graph Overlay on City Skyline Illustrating Data Analysis Concept Image

Bar graph juxtaposed with city skyline conveys idea of data-driven urban planning or business analysis. Useful for presentations, reports, or illustrating financial growth and research trends in an urban setting.
Powered by 


2
downloads
downloads
Tags:
More
Credit Photo
If you would like to credit the Photo, here are some ways you can do so
Text Link
photo Link
<span class="text-link">
<span>
<a target="_blank" href=https://pikwizard.com/photo/bar-graph-overlay-on-city-skyline-illustrating-data-analysis-concept/3ba8c5dc63ca0b14f0e2be124788c58d/>PikWizard</a>
</span>
</span>
<span class="image-link">
<span
style="margin: 0 0 20px 0; display: inline-block; vertical-align: middle; width: 100%;"
>
<a
target="_blank"
href="https://pikwizard.com/photo/bar-graph-overlay-on-city-skyline-illustrating-data-analysis-concept/3ba8c5dc63ca0b14f0e2be124788c58d/"
style="text-decoration: none; font-size: 10px; margin: 0;"
>
<img src="https://pikwizard.com/pw/medium/3ba8c5dc63ca0b14f0e2be124788c58d.jpg" style="margin: 0; width: 100%;" alt="" />
<p style="font-size: 12px; margin: 0;">PikWizard</p>
</a>
</span>
</span>
Free (free of charge)
Free for personal and commercial use.
Author: Authentic Images
Similar Free Stock Images

Premium


Premium


Premium


Premium


Premium


Premium


Premium


Premium


Premium


Premium


Premium


Premium


Premium


Premium


Premium


Premium


Premium


Premium


Premium


Premium


Premium


Premium


Premium


Premium