- Home >
- Stock Photos >
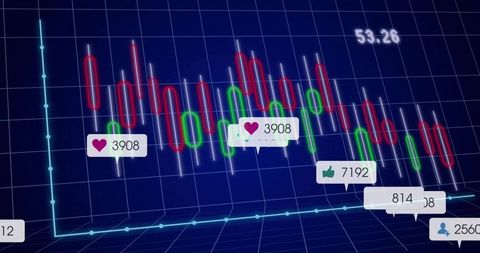
- Bear Market Analysis with Stock Graphs and Data Visualization
Bear Market Analysis with Stock Graphs and Data Visualization Image

Graphic features sharp bear outline overlaying stock charts indicating financial downturn. Arrow indicates bearish movement. Useful for illustrating financial reports, investor presentations, market analysis, and economy sections where market decline is discussed.

downloads
Tags:
More
Credit Photo
If you would like to credit the Photo, here are some ways you can do so
Text Link
photo Link
<span class="text-link">
<span>
<a target="_blank" href=https://pikwizard.com/photo/bear-market-analysis-with-stock-graphs-and-data-visualization/9b30a2cb634ca8c9d5e34a5497c087be/>PikWizard</a>
</span>
</span>
<span class="image-link">
<span
style="margin: 0 0 20px 0; display: inline-block; vertical-align: middle; width: 100%;"
>
<a
target="_blank"
href="https://pikwizard.com/photo/bear-market-analysis-with-stock-graphs-and-data-visualization/9b30a2cb634ca8c9d5e34a5497c087be/"
style="text-decoration: none; font-size: 10px; margin: 0;"
>
<img src="https://pikwizard.com/pw/medium/9b30a2cb634ca8c9d5e34a5497c087be.jpg" style="margin: 0; width: 100%;" alt="" />
<p style="font-size: 12px; margin: 0;">PikWizard</p>
</a>
</span>
</span>
Free (free of charge)
Free for personal and commercial use.
Author: Awesome Content