1. Home > 
  2. Stock Photos > 
  3. Bearded man pondering data analytics reclining on sofa with tablet and charts overlay

Bearded man pondering data analytics reclining on sofa with tablet and charts overlay Image

Bearded man pondering data analytics reclining on sofa with tablet and charts overlay

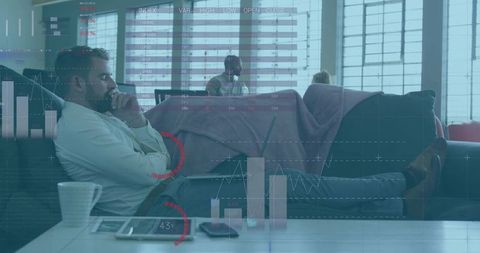
Bearded man pondering data analytics while reclining on sofa, tablet and laptop nearby, transparent charts and graphs overlaying scene suggesting dashboard and performance metrics. Office lounge background showing casual collaboration and remote work vibe, soft natural light creating calm professional mood. Useful for business presentations, technology websites, finance blogs, startup landing pages, corporate reports, and social media campaigns focusing on data-driven strategy. Design tips: placing headline text in upper-right area with generous copy space, applying brand color overlay to match visual identity, using as hero banner, background for slide deck, or feature illustration for analytics tools. Optimizing metadata and keywords for search visibility.

Powered by Shutterstock logo - Get 15% off with code: PIKWIZARD15
Analyst working with Business, Concept digital transformation technology strategy, Analytics and Data Management System on computer, make a report with KPI and metrics connected to database. - Powered by Shutterstock - Get 15% off with code: PIKWIZARD15African American woman analyzing financial data on laptop screen in hybrid office setting for digital entrepreneurship KPI dashboard. - Powered by Shutterstock - Get 15% off with code: PIKWIZARD15An analyst uses a computer and dashboard for data business analysis and Data Management System with KPI and metrics connected to the database for technology finance, operations, sales, marketing  - Powered by Shutterstock - Get 15% off with code: PIKWIZARD15Dashboard finance management on laptop computer analyzing sales data and growth graph chart report. Business planning, strategy and development. Financial accounting. market research, data analysis - Powered by Shutterstock - Get 15% off with code: PIKWIZARD15KPI Dashboard Data Analytics On Business Laptop - Powered by Shutterstock - Get 15% off with code: PIKWIZARD15

Credit Photo

If you would like to credit the Photo, here are some ways you can do so

Free (free of charge)

Free for personal and commercial use.

Author: Creative Art

Similar Free Stock Images

Business Professionals Collaborative Dashboard Analysis
Premium
Businessman analysis enterprise data management by AI artificial intelligence technology. Business analytics dashboard charts, metrics, KPI to improve, insight report for operation. Analyst marketing,
Businessman Discussing Data Insights Over Smartphone in Modern Office
Multiethnic Team Analyzing Financial Data with Interactive Charts
Businessman Analyzing Financial Data with Smartphone Technology
Collaborative Financial Data Analysis in Modern Office
Premium
Two businesspeople or an accountant team are analyzing data charts, graphs, and a dashboard on a laptop screen in order to prepare a statistical report and discuss financial data in an office
Business Team Discussing Analytics with Digital Data Overlay in Modern Office
Diverse Colleagues Engaged in Stock Market Analysis Discussion
Successful Businessman with Financial Graphs Overlay in Modern Office
Team Analyzing Financial Data in Modern Office Setting
Premium
African Businesswoman Using Analytics Data KPI Dashboard Tech
Diverse Team Analyzing Data with Futuristic Interface at Modern Office
Businesswoman Using Smartphone with Data Visualizations Overlay
Diverse Team Collaborating with Financial Data Analytics
Couple Analyzing Finances with Stock Market Data Digital Overlay
Premium
African Advisor Using KPI Dashboard With Financial Analytics Graphs
Financial Team Collaborating on Data Analysis in Modern Office
Business Professionals Working with Digital Financial Data Overlay
Senior Couple Analyzing Financial Data on Laptop
Financial Team Analyzing Global Economic Data in Modern Office
Premium
Businessman using KPI dashboard.Financial business KPI System data analytics graph dashboard.Data System KPI and metrics connected in database for follow earnings,operations and sales data.
Collaborating Business Professionals with Digital Stock Market Overlay
Cloud Computing Concept with Businessman Using Laptop
Financial Data Analysis Overlaid on Diverse Business Team in Office
Diverse Team Collaborating on Project with Data Overlay
Premium
Technology and financial advisory services concept. Business teamwork and working on digital laptop computer with advisor showing plan of investment to clients at table office. Digital marketing.
Woman in Open Plan Office Utilizing Technology for Productive Workday
Business Professionals Analyzing Market Data with Technology
Businessman Calling and Checking Watch in Open-Plan Coworking Space with Financial Overlays
Coworkers Collaborating Over Laptop in Open Office with Waveform Data Visualization Overlay
African American Woman Leading Data Analysis Meeting
Businesswoman Analyzing Data on Laptop with Financial Graph Overlays
Premium
Analyst Works on Personal Computer Showing business analytics dashboard with charts, metrics and KPI to analyze performance and create insight reports for operations management. Data analysis concept.
Global Business Meeting with Digital Financial Overlay
Diverse Workforce Analyzing Financial Data in Modern Office
Business Team Analyzing Financial Data with a Global Interface Overlay
Diverse Team Analyzing Augmented Financial Data in Modern Office
Premium
Man look at the dashboard with graphs and charts. Concept of data management system, business intelligence, data statistics, marketing analysis, key performance indicators (KPI) and analytics.
Global Financial Analysis Overlay on Business Collaboration
Team Collaboration with Digital Global Infographics
Businessman Analyzing Digital Data and Statistics in Modern Office
Couple Analyzing Stock Market Finances at Home with Technology Overlay
Premium
Data analytics and insights powered by big data and AI technologies. Data scientist analysing complex information with artificial intelligence for business analytics dashboard with charts and metrics.
Diverse Team Analyzing Stock Market Data with Technology in Office
Business Professionals Analyzing Data Driven Insights In Office
Mixed Race Man Using Laptop with Virtual Data Processing Overlay
African American Businessman Analyzing virtual Financial Data
Premium
work hard Data Analytics Statistics Information Business Technology
Diverse Team Analyzing Data and Business Graphs
Financial Analysis Meeting with Data Interface Double Exposure
Diverse Team Collaborating on Financial Data Analysis with Technology
Financial Data Overlay Diverse Team in Modern Office
Premium
Two analyst women using KPI dashboard for data analytics. Digital data technology concept
Teams Discussing Finance Analytics in Modern Office Environment
Diverse Team Analyzing Financial Data in Office with Overlay Graphics
Office Workers Discuss Stock Market Analysis
Innovative Team Brainstorming in Modern Office Lounge
Premium
Professional analyzing financial data graphs, charts on laptop display at a modern workspace. Financial analysis or business evaluation concept
Presenting Data-Driven Strategy in Modern Office Lounge with Collaborative Team Discussion
Young professional sitting in modern office lounge analyzing financial data overlay
Woman Presenting Laptop in Modern Open Office Showing Analytics Dashboards and Charts
Diverse Business Team Analyzing Data on Digital Tablet
Two Businesswomen Discussing with Projected Data on Screen
Businesswomen Discussing Strategies with Stock Market Data Overlay
Premium
Data analytics automated with AI technology. Big data, business analytics and artificial intelligence automation. Dashboard report with sales and operations charts and KPI insights on touch screen.
Team Discussing Financial Trends with Overlaid Analytics
Business Meeting with Data Visualizations Overlay
Diverse Professionals Analyzing Data Trends in Digital Environment
Diverse Team Analyzing Data in Office Video Conference
Premium
Data analytics and insights powered by big data and artificial intelligence technologies. Data scientist working with complex information analysed by AI for business analytics dashboard with charts.
Businessman Analyzing Financial Data in Modern Office/Coffee Shop
Businessman Analyzing Digitized Financial Data in Modern Office
Digital Team Collaboration in Modern Office Environment
Businessman Analyzing Data with Digital Graphics Overlay
Premium
Business data dashboard analysis by ingenious computer software . Investment application display business sales and profit on the computer screen and advise marketing planning decision .
Colleagues Discussing Financial Data Analysis in Office
Business Professionals Analyzing Data with Financial Charts Overlay
Diverse Couple Experiencing Digital Overload with Data Overlay
Creative Presentation in Modern Office with Digital Interface
Premium
Two businesspeople or an accountant team are analyzing data charts, graphs, and a dashboard on a laptop screen in order to prepare a statistical report and discuss financial data in an office
Financial Data Analysis Over Business Professionals
Colleagues Analyzing Financial Data on Office Monitor
Business Professionals Analyzing Financial Data on Office Laptops
Financial Analysis with Diverse Team Brainstorming in Modern Office
Premium
Businessman pointing chart financial goals and economic business planning global.
Financial Analysis with Diverse Team Collaborating in Office
Digital Biometrics Analyzing Corporate Meeting in Glass Panel Room
Business Professionals Engaged in Data Analysis with Overlays
Modern Business Team Collaborating in Innovative Workspace
Premium
Advisor using KPI Dashboard on virtual screen.Business finance data analytics graph.Financial management technology.
Leader pointing at laptop while team reviews interactive analytics and financial charts
Business presenter gesturing during financial analytics review with laptop and chart overlays
Digital Finance Innovation in Modern Workplace
Businesswoman Analyzing Data with Digital Financial Growth Chart
Woman Analyzing Data with Technology Graph Projections
Diverse Business Team Discussing Papers in Modern Office
Premium
Businessman using laptop computer analyzing sales data and financial growth graph chart report. Business planning, strategy and development. Financial accounting. market research, data analysis
Financial Analysis and Presentation with Diverse Team Collaborating
Digital Data Processing with Businesswoman in Office
Businessman Analyzing Digital Data Overlays with Laptop
African American Businessman Analyzing Financial Reports
Premium
KPI, Key Performance Indicator. Businessman using KPI dashboard to analysis data System. Earnings,operations and sales data. Financial business data analytics graph dashboard. New goals.
Businessman Using Laptop with Science Technology Overlay
Business Professional Using Smartphone with Digital Infographic Overlay
Financial Analysis with Global Data Overlay in Modern Office
Innovative Team Collaborating on Software Development in Office
Premium
Analyst working with Business Analytics and Data Management System on computer to make report with KPI and metrics connected to database. Corporate strategy for finance, operations, sales, marketing
Financial Data Analytics Collaboration in Modern Office Environment
Diverse Professionals Analyzing Financial Data Together
Business Team Collaborating Overlapping with Financial Data Digital Display
Diverse Colleagues Danalyzing Data on Laptop in Modern Office
Premium
Financial Data Analyst Female Using KPI Dashboard On Laptop
Collaborative Team Analyzing Stock Market Data in Modern Office
Diverse Team Engaging in Strategic Data Analysis Meeting
Diverse Business Team Discussing Financial Data Insights in Office
Office Team Working on Financial Data Analysis with Digital Interface Overlay
Premium
Analyst working with computer in Business Analytics and Data Management System  with KPI and metrics connected to the database for technology finance, operations, sales, marketing. Data analysis.Ai
Coworkers Analyzing Business Growth Metrics on Tablet
Businessman Engaging with Digital Data Analysis Interface
Team Analyzing Financial Data in Modern Office Lounge
Tech Analyst Wearing Earpiece Scanning Monitor with Augmented Data Dashboards in Open Office
Premium
Businessman analyzing a business analytics (BA) or intelligence (BI) dashboard on virtual screen showing sales and operations data statistics charts and key performance indicators (KPI)
Professional typing on laptop with financial data analytics overlay in coworking space